Blog Post
Call for Code: Water sustainability data sets
Learn about data sets and models for water sustainability and agriculture as well as some basic tools to manipulate them
Webinar series starting March 2020 – Sustainable food systems and nutrition: Food post-harvest losses
Note: There is a webinar on March 25, 2020, organized by Agreenium (l’Institut agronomique, vétérinaire et forestier de France), UN-ESCAP (United Nations Economic and Social Commission for Asia and the Pacific), and FAO (Food and Agriculture Organization of the United Nations) on how can we better measure and reduce post-harvest losses worldwide, especially in Southeast Asia countries. Join the webinar and share your thoughts and ideas! The webinar is at 2:30 PM (CET) and 9:30 AM US Eastern. Get more information about the webinar here. The session is the first in a series.
Call for Code: Water sustainability data sets
Following on from the Useful data sets for Call for Code blog, I’ll now share some information on data sets and models for water sustainability and agriculture as well as some basic tools to manipulate them. Agriculture is the largest consumer of water at about 70% of all withdrawals globally as stated by the World Bank. To emphasize the point, an article at Penn State entitled “How much water does it take to make a pair of jeans?” states:
“It takes around 1,800 gallons of water to grow enough cotton to produce just one pair of regular ol’ blue jeans. That’s more water than it takes to make a ton of cement”
You can find some water-, agriculture-, soil-, and crop-related data sets through the Google Dataset Search Tool, as described in the earlier Useful data sets for Call for Code blog (pay attention to the license when you download the data sets). You can also find water-related data sets in the various government websites listed in that blog and in other locations such as the Oak Ridge National Lab in the US. See the Get Data section.
Another great source is the Food and Agriculture Organization (FAO) at the United Nations, whose goal is to ensure that people have regular access to enough high-quality food to lead active and healthy lives. The organization compiles data sets such as the http://www.fao.org/aquastat/en/countries-and-basins/country-profiles data set in collections such as http://www.fao.org/aquastat/en/. The European Data Portal https://www.europeandataportal.eu/data/datasets has data sets for agriculture and other important categories. On data.world (https://data.world/), you can find data sets about soil. You will find more suitable data sets in many collections to help you motivate your Call for Code solution and tell the story, or to build your solution by:
- Visualizing data, perhaps as part of a dashboard
- Using data in an application
- Training or using a model to make predictions
Visualizing data
The Humanitarian Data Exchange (HDX) is an open data-sharing platform managed by the United Nations Office for the Coordination of Humanitarian Affairs. In the exchange, you will find a climate change data set for each country that is derived from world bank data. The climate change data sets typically track indicators such as arable land, land under cereal production, and fertilizer consumption over a number of years. The indicators will vary from country to country, but will help you tell a story around your solution. You can find and download the climate change country data sets by selecting a location or by using the search option. For example:
You can also create quick graphs using the HDX tools.
GeoJSON is sometimes used as a format for data on the HDX site. For example, https://data.humdata.org/dataset/indicator-6-3-2-proportion-of-bodies-of-water-with-good-ambient-water-quality-percent is a data set of the proportion of bodies of water on earth with a good ambient water quality (%) indicator. GeoJSON is a format for encoding geographic data structures. The Pandas Python library is an excellent tool to manipulate GeoJSON files along with many other data formats including the popular CSV format. You can learn how to use Pandas by following this Call for Code tutorial.
The following image shows a simple visualization of the ambient quality data set mentioned above created with GeoPandas, which is another Python library focused on Geospatial data. The top portion shows the data set in GeoPandas with all of its attributes, followed by two simple map plots illustrating the various GeoAreaNames by location.
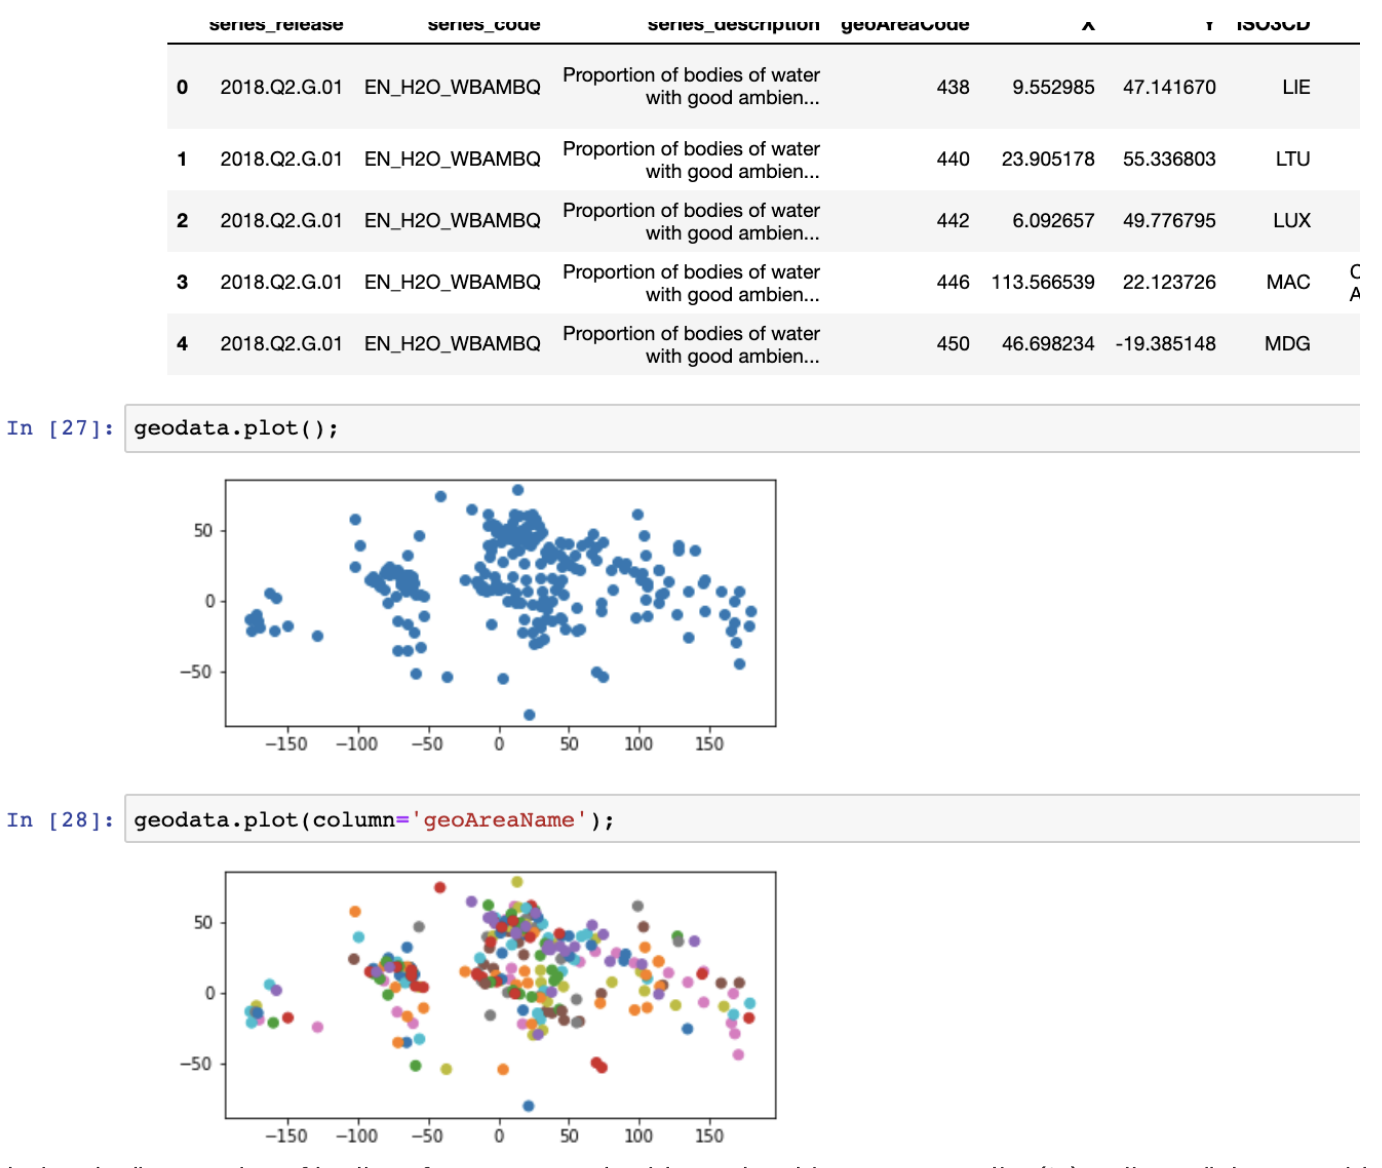
Exploring the “proportion of bodies of water on Earth with good ambient water quality (%) indicator” data set with GeoPandas
Another site that makes data available through GeoJSON is GreenSpin, whose stated goal is to “digitize, quantify and monitor every single agricultural field on the planet.”
Using data in an application
A simple way to access and explore any data that you have downloaded from one of the sites is to load the data in a JSON format to the Cloudant JSON database, and then access the data through Cloudant’s HTTP API. The following videos explain how to do that.
There are many easy tools like cURL to issue HTTP requests. Find out more in this article that introduces the HTTP tools.
Using a model for water and agrarian solutions
AquaCrop-OS is a free, open source version of AquaCrop, a crop water productivity model developed by the Food and Agriculture Organization of the United Nations (FAO), mentioned earlier in this blog. AquaCrop-OS simulates water-limited crop production across diverse environmental and agronomic conditions. AquaCrop-OS covers multiple crop types and environmental conditions, and is designed specifically for regions where water is a critical limiting factor in crop production. The model can be used from multiple programming languages and operating environments.
- You can read more about the model in this article entitled AquaCrop-OS: An open source version of FAO’s crop water productivity model published in 2017].
- You can find the user manual at https://www.aquacropos.com/uploads/1/0/9/8/109819842/aquacropos_usermanual_v60a.pdf.
- You can download the model at https://www.aquacropos.com/download.html.
There are more useful open source models on the Model Asset eXchange such as the Weather Forecaster, which takes hourly weather data as input and returns hourly weather predictions for variables such as temperature or windspeed. You can learn more about the Model Asset eXchange through this tutorial.
Academic connections and journals
There are numerous articles that deal with water, agriculture, and related topics. Some universities specialize in them, such as Wageningen University. One resource at the university is Multifunctional agriculture WUR-INRA, which is a long-running project of the Farming Systems Ecology Group. It aims to provide scientific support for continuous and sustainable development of agro-ecosystems.
There are also a lot of papers about weather forecasting such as “Weather Forecasting Using Sliding Window Algorithm” at https://www.hindawi.com/journals/isrn/2013/156540/.
You can also look at the Creating a water risk index to improve community resilience (L. El Gammal; W. Kong; D. Prosdocimi) article from the IBM Journal of Research and Development, which talks about quantifying risks from flooding for insurance purposes.
Abstract: Flood risk reduction is an existent discourse and agenda in policy and insurance. Existing approaches such as linking hydrological models to economic loss models may be highly inequitable between areas of different socio-economic vulnerability. To our knowledge, no one has tried to adapt the more advanced known heat risk theory by first informing flood risk with the socio-economic vulnerability, and then investigating the sensitivity of risk reduction policies to that flood risk. In this article, we demonstrate two methods to combine water hazard data with a derived water vulnerability index to characterize water risk. We then compare the costs of two potential government policies: buyout of the home versus funding for foundation elevation. We use the case study area of Pittsburgh, PA, which faces severe precipitation and riverine flooding hazards. We find that while small differences in characterizing flood risk can result in large differences between flood risk maps, the cost of the flood risk reduction policy is not sensitive to the method of representing the socio-economic vulnerability. This suggests that while validation of flood risk incorporating socio-economic data is needed, for some policies, policymakers can prioritize environmental justice with little to no additional cost.
You can download a full copy of the article IJRD-64-18-Creating_a_water_risk_index_to_improve_community_resilience.pdf and read more about the other articles in the journal. Increasingly, articles are accompanied by data sets, so it’s always worth looking at recent academic publications on water and agriculture.