Did you know the CICS Explorer not only includes a great development environment for Java, but also a remote debugger?
Quick guide to starting a debug session:
- Ensure the JVMSERVER resource used by your Java application is disabled, or not yet installed.
- Add the following two lines to the JVM profile.
-Xdebug
-Xrunjdwp:transport=dt_socket,server=y,address=27508,suspend=n
Change the "address=" option to a IP port number on z/OS that is not already being used, the default CICS region userid is authorised to open, and your workstation can connect to. A link describing the options for runjdwp – run Java Debug Wire Protocol – is in the references section below.
- Enable the JVMSERVER resource.
- Install the BUNDLE resource that contains your CICS Java application.
- In CICS Explorer, switch to the debug perspective via menu option Window > Open Perspective > Other > Debug > OK
- Select menu Run > Debug Configurations
- Create a new entry under "Remote Java Application", filling in the Project (your OSGi plug-in project that contains the source to debug), Host and Port (your z/OS system host name, and port entered in step 2).

- Click "Debug" to start the debug session.
If a "Failed to connect to remote VM" message is shown, check the JVMSERVER resource is enabled and that your workstation can reach the z/OS host.
- Switch to the Plug-in perspective, navigate to the Java class you need to debug and edit it.
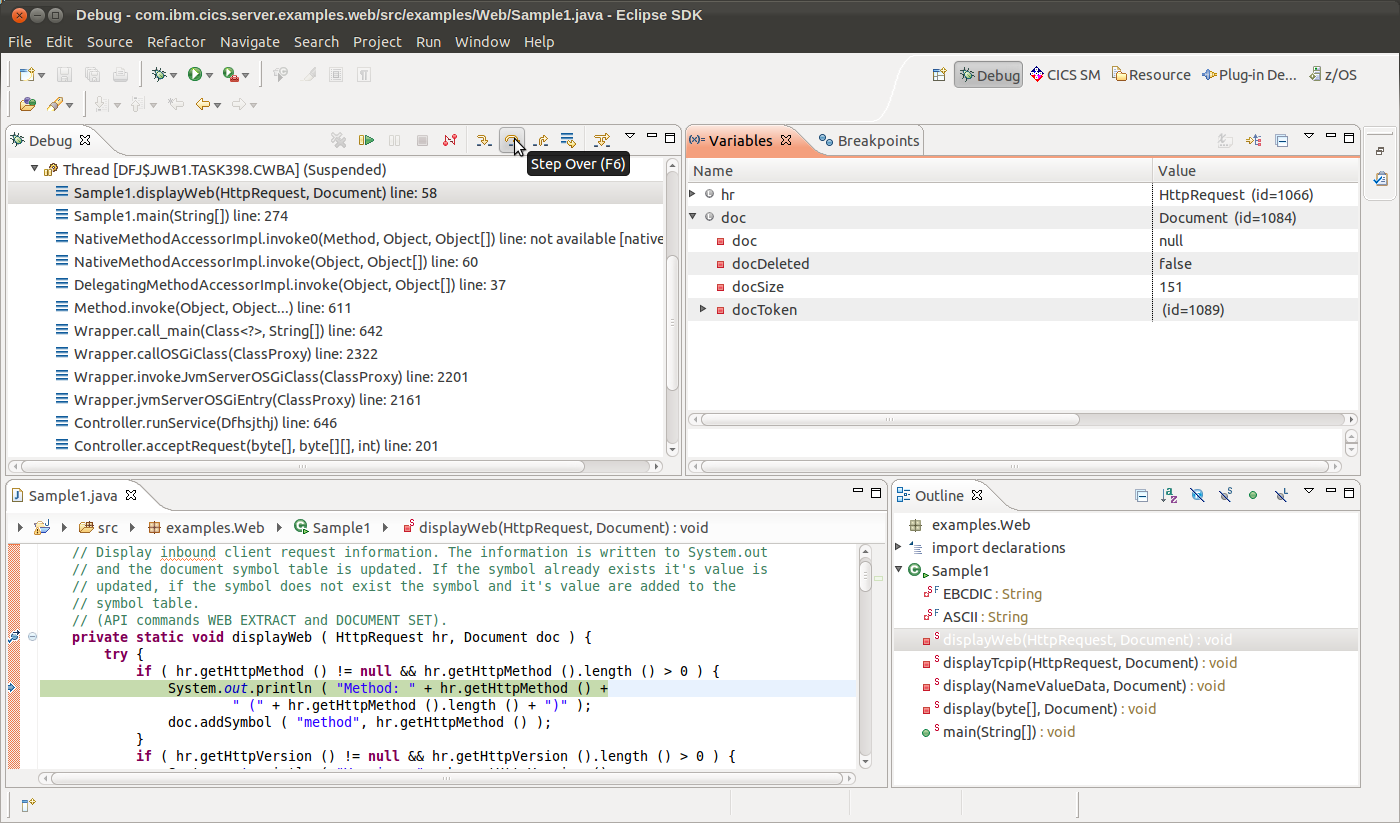
- Double click in the margin to create a break point. Each break point appears as a blue dot in this margin.
- Run your CICS Java application.
- When the break point hits, CICS Explorer will switch automatically to the Debug perspective and you can now step through your code, watch variables etc. If you hover the mouse over a variable in the source a popup window will show you the current value.
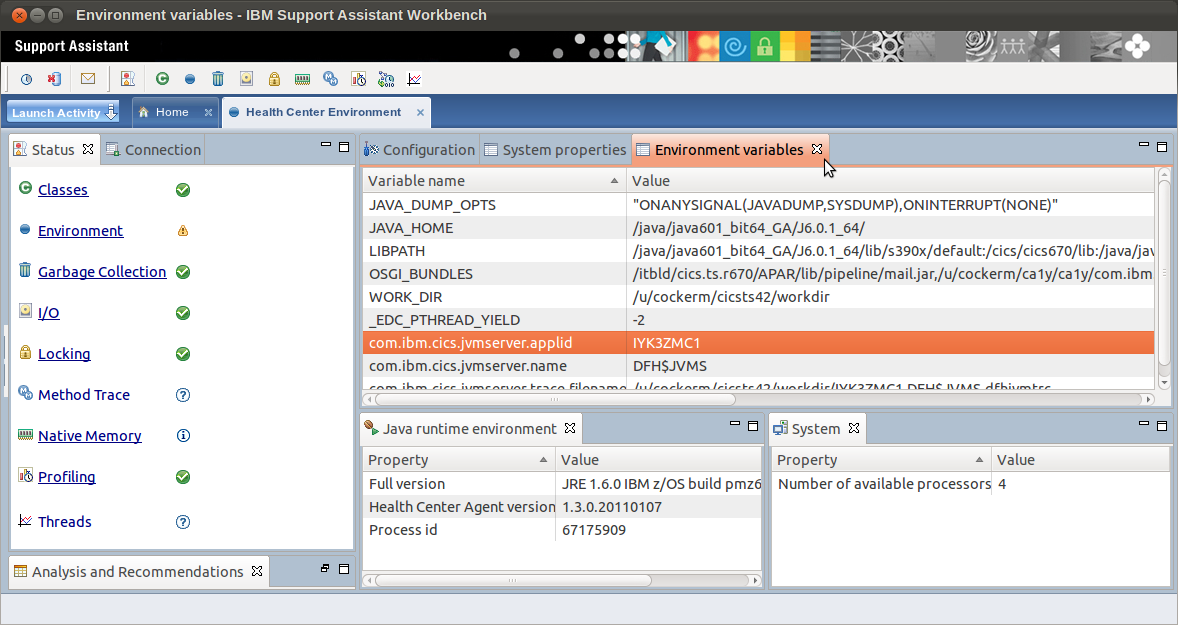
Once you have this working, you may also want to look at the free IBM Monitoring and Diagnostic Tools for Java (aka IBM Health Center) that can be used to profile and tune your CICS Java application. Add "-Xhealthcenter:port=27509" (replacing the port number) to your JVM profile.
References: