IBM z/OS Debugger boasts many
fixes and new features in v14.1.5:
IBM Z Open Development
z/OS Debugger is now included in
IBM Z Open Development! With IBM Z Open Development, you will be able to remote debug using the modern language editors, add source entry breakpoints, and use visual debug. Click
here for a full list of z/OS Debugger features by product.
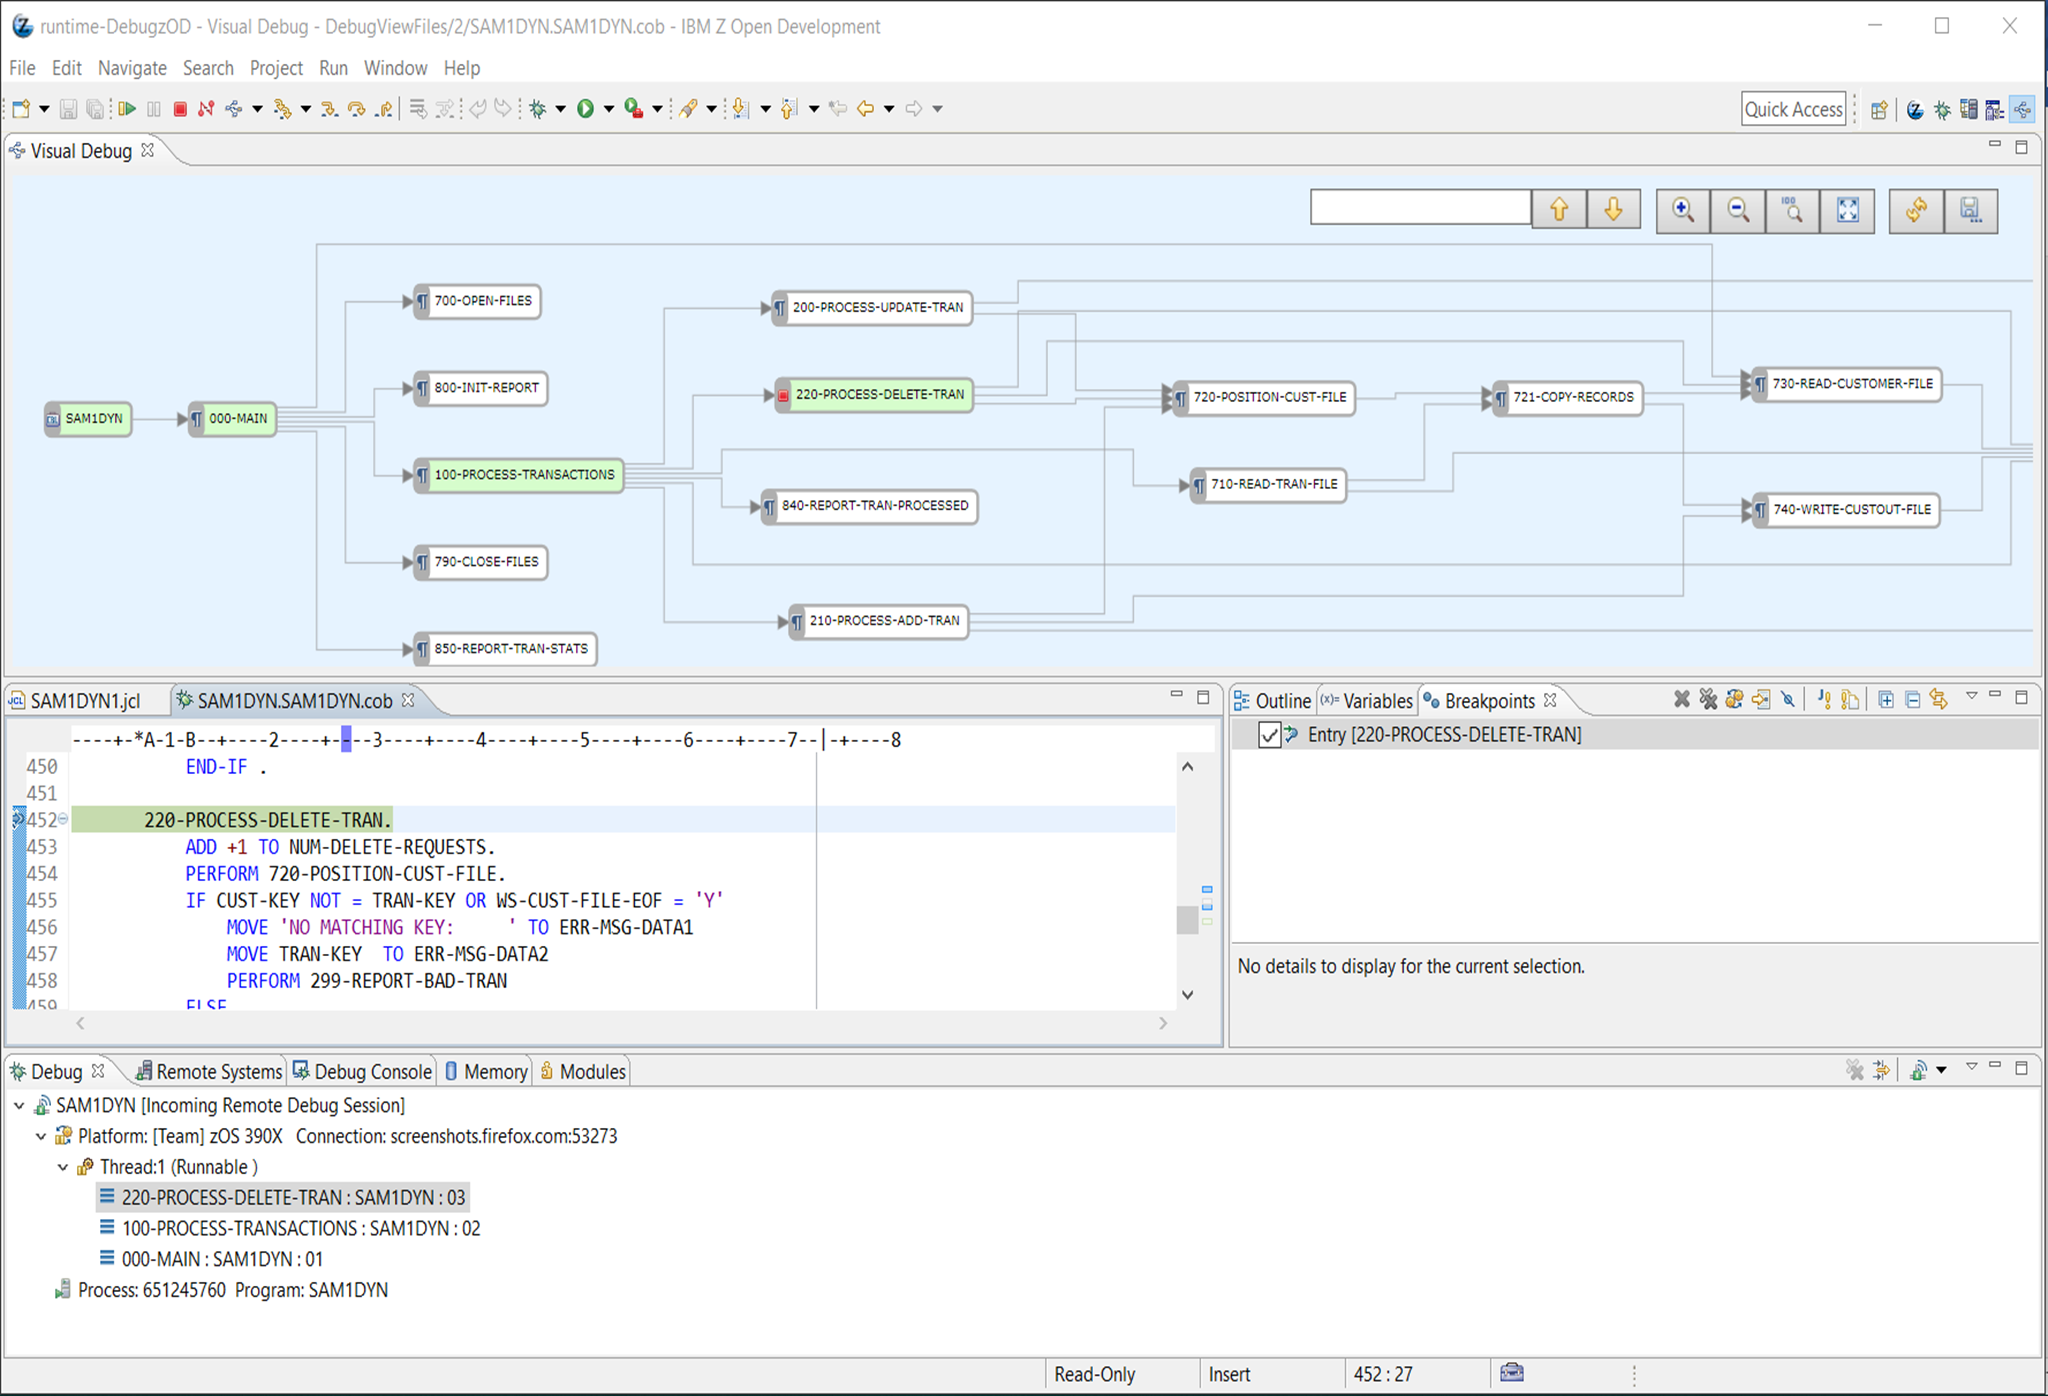
Visual Debug
Visual Debug has received the benefit of numerous updates in this release. Available in all clients, except for IBM Debug for z Systems, it now supports Debug Tool compatibility mode, and runs on macOS. A new Visual Debug perspective has been added to help users optimize their visual debug experience:
To enable visual debug, along with the v14.1.5 client or IBM Z Open Development client v1.0, ensure that you have host
PTF UI60046 applied, and then click on the Enable visual debug button after you have launched a debug session:

Paragraph and Source Entry Breakpoints
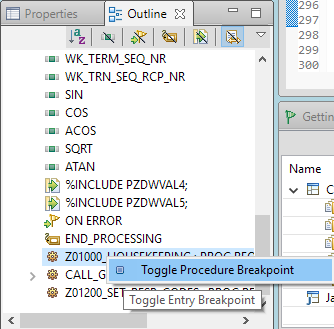
Source Entry breakpoints can now be added for PL1 and COBOL prior to starting a debug session in Debug Tool compatibility mode. Source Entry breakpoints are available with all clients, except IBM Debug for z Systems. To create a source entry breakpoint, either right-click in the left ruler in the editor and select
Add procedure breakpoint, when editing PL1 or
Add paragraph breakpoint, when editing COBOL.

Alternatively, you can add breakpoints from the outline view:
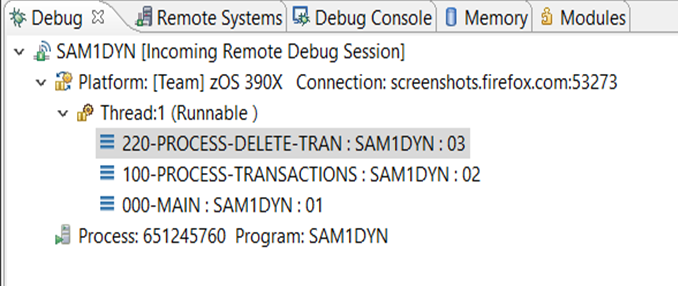
Additionally, when debugging COBOL in Debug Tool compatibility mode, paragraphs now appear in the stack:
Entry paragraph breakpoints can be added in the Visual Debug View, or via the Modules view (either in the new Visual Debug perspective, or the standard Debug perspective):
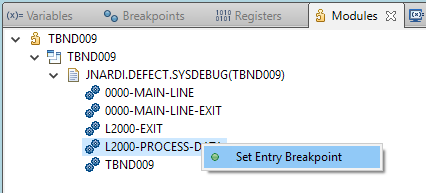
Don't forget to
read about the limitations of paragraph breakpoints.
Additional Enhancements and Updates
- Support is added for CICS Transaction Server for z/OS Version 5 Release 5.
- Support is added to the ISPF z/OS Debugger Utilities remote debug mode selection to use the Debug Manager and a user ID (DBMDT) to identify the workstation.
- A new preference is added so that you can set or clear the global engine search path on the Compiled Debug preference page. This preference applies to all incoming debug sessions that cannot be matched to a launch.