Where is it?
If you are working with a new workspace, you should already see the new z/OS Debugger Profiles view at the bottom of the
Debug perspective, near the
Console view:

If you are using an existing workspace, you can either open the view using the
Window > Show view > Other menu action, and selecting the view from the resulting dialog:

Or you can choose to use the
Window > Perspective > Reset Perspective menu action in the Debug perspective.
Using the context menu
Wondering what actions can be performed with a profile? Accessing the context menu is as simple as a right-click on any profile in the view:

Switch between running a debug session and a code coverage session by activating the profile in whatever mode you desire.
Key bindings
You can also see from the above screen capture that there are keys you can use to access all the actions. Don't like the default bindings? You can use the Keys preference page to change them:

Another way to activate a profile
In addition to the context menu and the key bindings, you can activate or inactivate a profile directly from the view. Simply click in the Active Mode column of the profile you want to change, and select the desired option. Don't forget to press Enter to register your change.
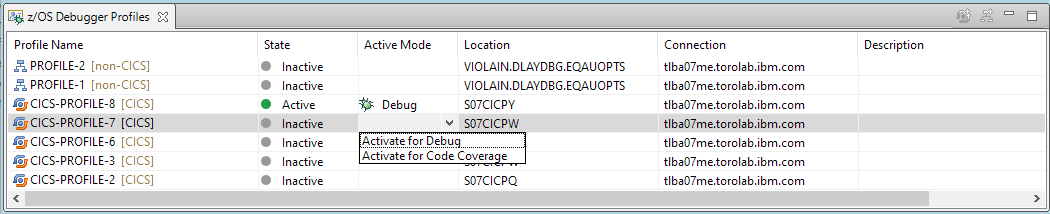
Note that a profile may only be active in either debug or code coverage mode. A user may only have one active CICS profile per region, and one active non-CICS profile per z/OS system.
So many profiles, which one do I want...
It may not take you very long to accumulate many profiles. If you are like me, you may end up leaving the default name and not setting a description, trying to figure out which profile you want to activate might be troublesome. The solution is easy: simply hover the mouse (or use Ctrl+F2) to show the basic tooltip for the profile:

The tooltip will show you all the basic CICS or non-CICS filters you have defined for your profile.
Give me details!
If you are looking for more profile information than what is provided in the basic tooltip, the advanced tooltip may be just what you are looking for. To get to the advanced tooltip, click the
Show Details link (or use Ctrl+Shift+F2)

Where did that profile come from?
For RSE connections that have the Debug Profile Service installed and running, the z/OS Debugger Profiles view supports synchronization. This means when you sign on with the RSE connection, the view checks to see if you have any profiles on the remote system. If it can match the remote profile with any one in your workspace, you will see the status of the profile get updated, if needed. If it cannot match the profile, a new one will be added to your workspace. Generally, this will happen if you switch between remote debugging and full screen debugging, and create profiles using 3270.
Read more about the z/OS Debugger Profiles view in
Working with the z/OS Debugger Profiles view.