Let's take a look at how easy it is to debug a CICS transaction using the new debug profiles user interface with the Debug Profile Service!
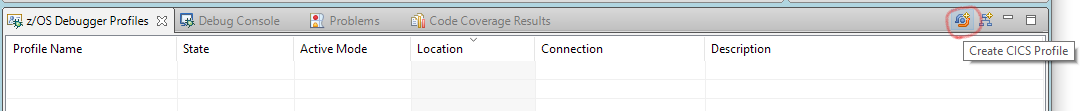
First, I need to create a CICS profile, so I click on the
Create CICS Profile button the z/OS Debugger Profiles view:
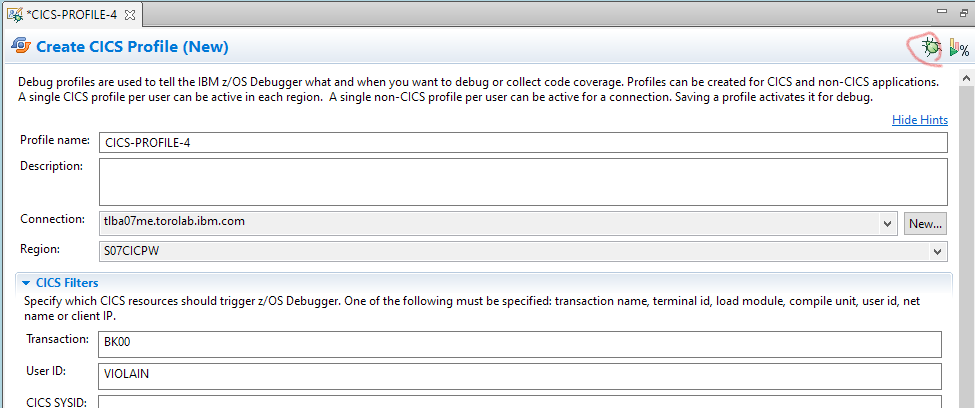
This now opens the Debug Profile Editor, by default hints for each section are visible, but I can turn those off by clicking on the
Hide Hints link.
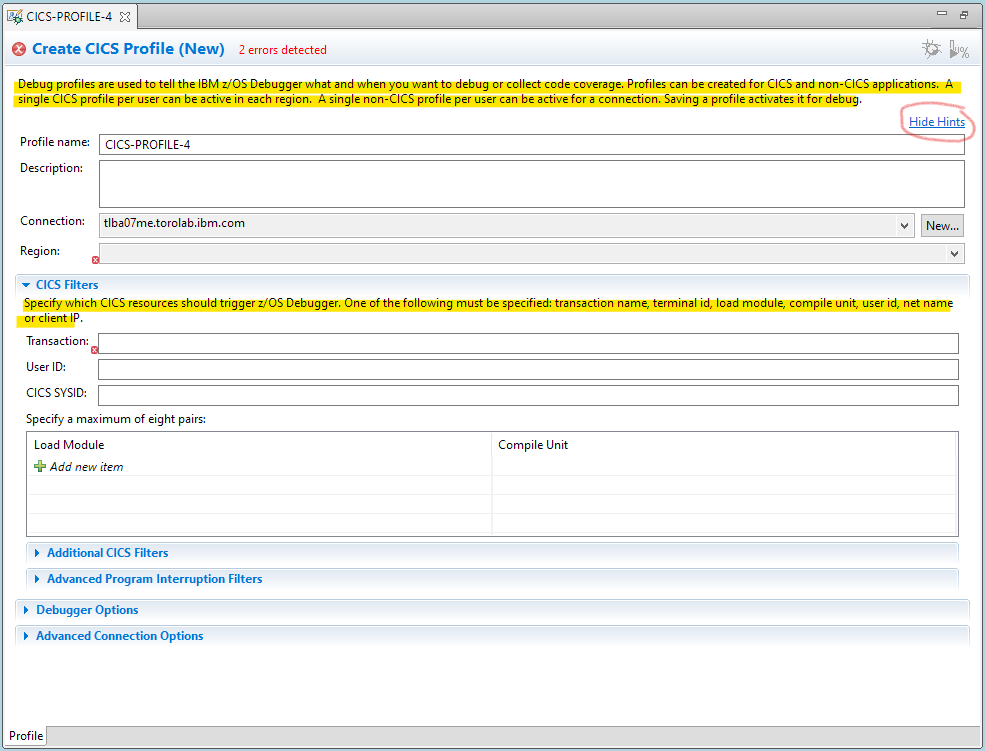
The editor also informs me that there are errors. When I hover my mouse over the errors, I see I have mandatory information to fill in:
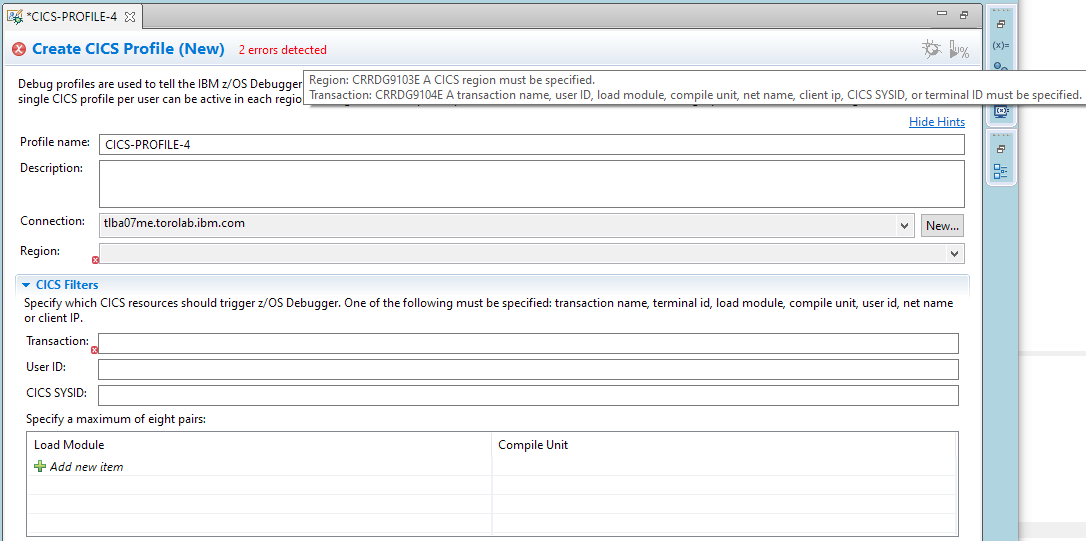
I already have an RSE z/OS connection, so the connection is already pre-filled (I could have used the
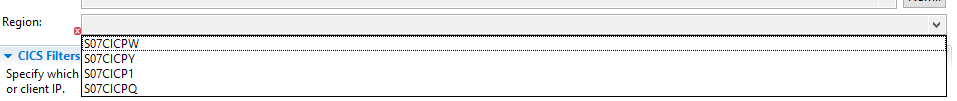
New button to create a connection in a new workspace that does not have any RSE connections defined), and now I need to select the region where I want to debug my transaction. Having the Debug Profile Service running makes my life easier because I can just select the region from the combo instead of remembering what port is enabled for the DTCN API (so many numbers in my head and what often happens is that I spend way too much time trying to find this information in my notes, and finally end up having to ask a teammate).
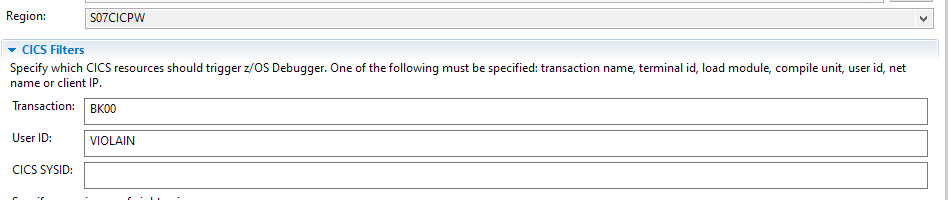
Now that I have the basics, I still need to tell the z/OS debugger what I want to debug - so I need to specify some filter. The easiest filter, of course, is transaction, and I only want my user ID to trigger debug sessions, so I add that information:
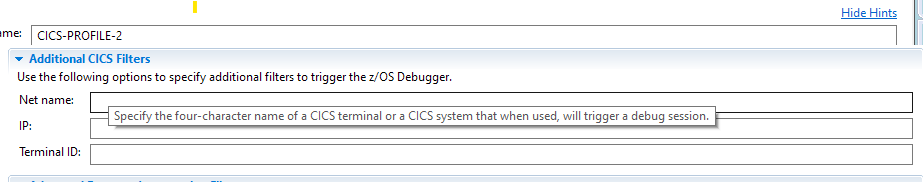
There are many more options I can specify so that the debugger is only triggered when I need it most. I can use the tooltips to read more details on these fields and ensure that I specify appropriate values:
After I have already specified what I need, I click on the
Save and Activate for Debug button.
I can see in the profile view that my profile is now activated in debug mode:

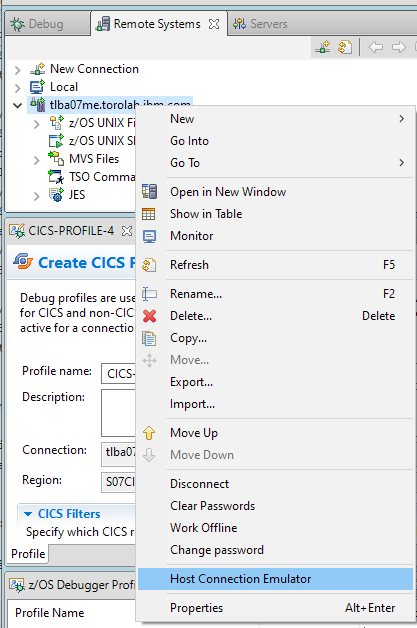
Now I switch to the emulator to run my transaction. Since I am running with IDz, I can launch the emulator from my RSE connection using the Host Connection Emulator:
The debug session starts and I can start stepping through the code, setting breakpoints, inspecting variables, etc.
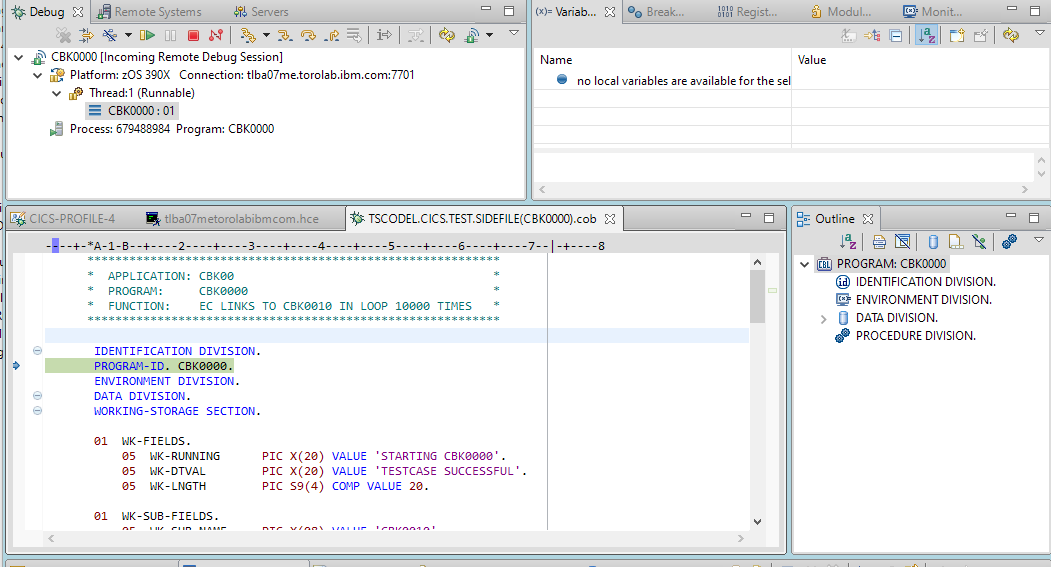
I click the terminate button