V14.2.2 is an exciting update for IBM z/OS Debugger! In addition to many fixes (
19 APARs between host and client), this release has some key new features:
COBOL 6.3 Dynamic Length Elementary Support
In 14.2.1, z/OS Debugger added support for UTF-8 variables, and this time we add support for dynamic length elementary variables. You will now be able to view the contents of the variables and interact with them as you would with any other variable.
New Debug Profiles User Interface
You spoke, and we listened! Its taken us some time to iterate, obtain feedback and get things just right, but the z/OS Debugger team is happy to finally be able to share our new and simplified debug profiles user interface. We have incorporated numerous suggestions for new debug users, as well as keeping veteran debug users in mind. The new interface leverages the Debug Profile Service (introduced in 14.2.1) for the best user experience, but allows for systems which have not yet updated.
As part of this simplification, we have removed the following launch configurations:
- Remote CICS Application launch configurations
- Remote IMS Application launch configurations
- Remote DB2 Application launch configurations
Remote CICS Application launch configurations are replaced with CICS profiles. Remote IMS Application launch configurations and Remote DB2 Application launch configurations are replaced with non-CICS profiles. If you have any of these launch configurations, they will be migrated once you open the new z/OS Debugger Profiles view.
In addition, the new user interface will replace the legacy DTCN and DTSP views from the Debug Tool plugins. The DTCN and DTSP plugins are now deprecated and will be removed in a future release. DTCN profiles are replaced with CICS profiles, and DTSP profiles are replaced with non-CICS profiles. Any existing profiles in your workspace will be automatically migrated to the z/OS Debugger Profiles view when opened.
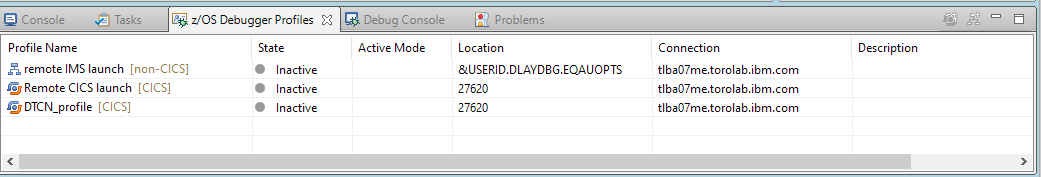
z/OS Debugger Profiles view
New workspaces will now have the z/OS Debugger Profiles view automatically opened in the Debug perspective. If you have an existing workspace, you can either use the
Window > Show view > Other menu action or the
Window > Perspective > Reset Perspective menu actions to open the view. The z/OS Debugger Profiles view is listed under Debug in the Show View dialog:

Once you have the view opened, you will see the welcome panel

Click on the
here link to hide the message and start working with your profiles:
This new view replaces the four different views that were used to manage profiles with the Debug Tool plugins, as well as the Launch Configuration dialog that was used for the removed launch configurations listed above. For more information on the z/OS Debugger Profiles view see
Working with the z/OS Debugger Profiles view and take a peek at my blog entry
Tips and Tricks in the z/OS Debugger Profiles view.
Debug Profile Editor
The Debug Profile Editor has taken all the different fields that were spread across over 10 different user interfaces (yes more than 10!) and consolidated them into a single simplified user interface and editor. To make life easier we have grouped information into different sections and provided hints on what each section is for. Experienced debug users can remove the extra text by clicking on the
Hide Hints link:

We've also provided additional tooltip assistance in most fields, to eliminate the need for reference guides. Hover your mouse to see tooltips:

You no longer need to figure out if the Debug Manager is running, or configure your profile with the Debug Daemon port and determine your client IP address. Simply activate a profile and the new Debug Profile Editor and the z/OS Debugger Profiles view will automatically detect the information and configure the profile for you.
Using the Debug Profile Service with the Debug Profile Editor makes it even easier:
- For CICS profiles, simply select the region for the profile from the pull-down list instead of having to know the port number for the DTCN API.
- For non-CICS users, no need to know the data set naming configured in the EQAOPTS file, the Debug Profile Editor can obtain this information from the Debug Profile Service.
For more information on installing and configuring the Debug Profile Service see
Adding support for Debug Profile Service and APIs.
Learn more details on the Debug Profile Editor with
Creating a debug profile for a CICS application, and
Creating a debug profile for a non-CICS application, and take a look at my other blog entries
Using a debug profile to debug or collect code coverage for a CICS transaction and
Using a non-CICS debug profile to debug batch applications.
z/OS Batch Applications
The following two new debug launch configurations, have replaced the old MVS Batch Application launch configurations:
- z/OS Batch Application using existing JCL
- z/OS Batch Application using a property group (not available in IBM Debug for z/OS)
When you access the z/OS Debugger Profiles view or the launch configuration dialogs, the old launch configurations will be automatically migrated to one of these two launches, if there are any. Having two launch configurations has helped us simplify things by reducing the clutter and complexity for the launches.
For more information, see
Launching a debug session for z/OS batch applications and a step-by-step example in the blog entry
Using a launch configuration with existing JCL to debug or collect code coverage with a batch application.
TEST runtime option
We did not stop with simplifying the the user interface. If the Debug Profile Service is running, the debugger will also accept using a simplified TEST runtime option in conjunction with your debug profile, making delay debug and launching the debugger easier. I say easier, because with this change, you can just specify a
TEST option with no additional options, and you no longer need to bind an EQAOPTS module for the sole purpose of using delay debug! See
Simple TEST option for more details.
Documentation Updates
We've also updated some of our documentation:
- Combined Debug Manager (DBGMGR) with Adding support for remote debug users to provide system programmers with clearer instructions about configuring for remote users. To use Eclipse GUI as the debugger interface, see the instructions in Adding support for remote debug users.