IBM Z Open Debug - Profile View
Change is the only constant thing! Technology evolves and so does our z/OS Debugger. Starting from last spring, our team has been working to bring you a new integrated debugging experience so that you can debug and manage your profiles directly from within Visual Studio Code.
Today, we are announcing the launch of our two extensions
Z Open Debug and Z Open Debug - Profile View for Visual Studio Code, closing a gap in the workflow that we and our fellow z/OS application developers experience every day: The ability to manage profiles and debug inside your favourite IDE: VS Code. The extensions can be downloaded from
Mainframe Dev Center- IBM Developer for z/OS Enterprise Edition (VSCode) or
AQUA staging site.
Learn more about our Z Open Debug extension
hereCheck out our document
Install IBM Z Open Debug for installation details.
In this blog post, we will explain the Z Open Debug - Profile View and how z/OS users can take advantage of it.
Managing your z/OS Debugger Profiles
The new Z Open Debug - Profile View extension is designed to help you manage debug profiles from within Visual Studio Code with the following functions:
- Authenticate and connect Visual Studio Code to a z/OS host.
- Create and save the CICS and non-CICS debug profiles.
- Activate a debug profile and start debugging.
Setting up remote connection
Before launching the view, let’s add a few workspace settings in VS Code.
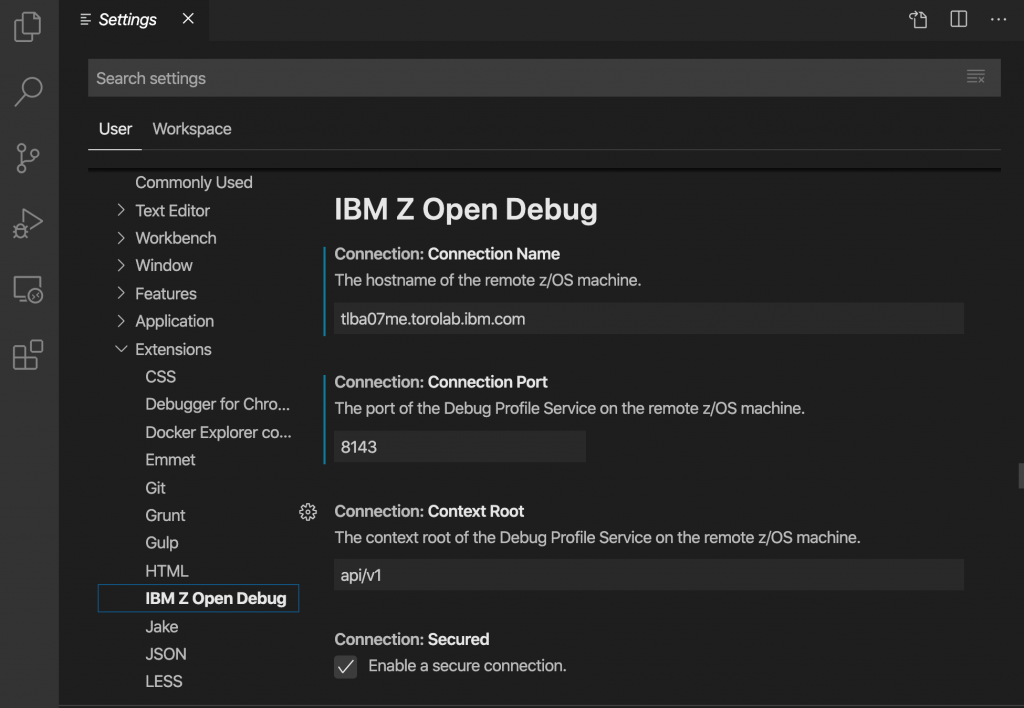
In VS Code's Settings, the configurations for IBM Z Open Debug can be found by expanding Extensions in the list on the left. Click on the entry
IBM Z Open Debug. Preferences like z/OS host name and username can be added here.
For more information, see
Setting up for IBM Z Open Debug.
Launching Z Open Debug - Profile View
The Z Open Debug - Profile view can be launched by using
View > Command Palette > Debug: Z Open Debug Profiles.
Welcome page:
The first view of the Z Open Debug - Profile View. Let's get started!

Profile view:
The profile view displays your list of debug profiles. The view is very simple and clean, making it easier to manage your debug profiles. This view allows you to create multiple profiles which are saved locally in the Z Open Debug specific folder in VS Code, making it easier to navigate to your saved profiles.

Creating a debug profile
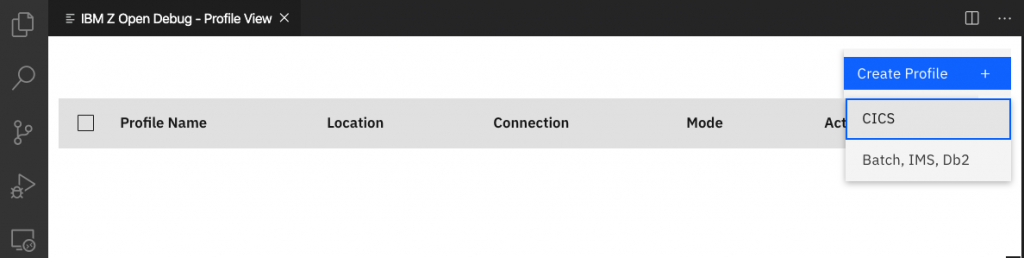
Tired of finding the right icons and buttons ? Well , we have simplified it a lot.
The view provides you with the options to create CICS and non-CICS profiles (IMS, DB2 and Batch) with just a single CREATE button.
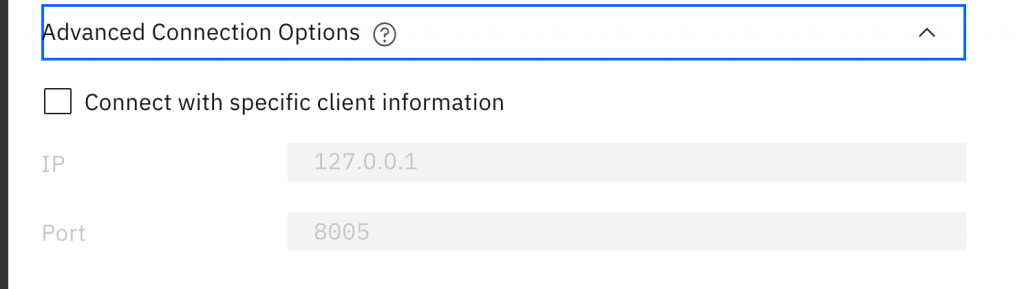
The choice of profile generates a form with a set of fields guiding you through required and optional input fields. The fields are simplified for you with expandable sections which contains all the optional fields and contains advanced filters you wish to add to the profile. You don't have to worry anymore about the filters you don't need.
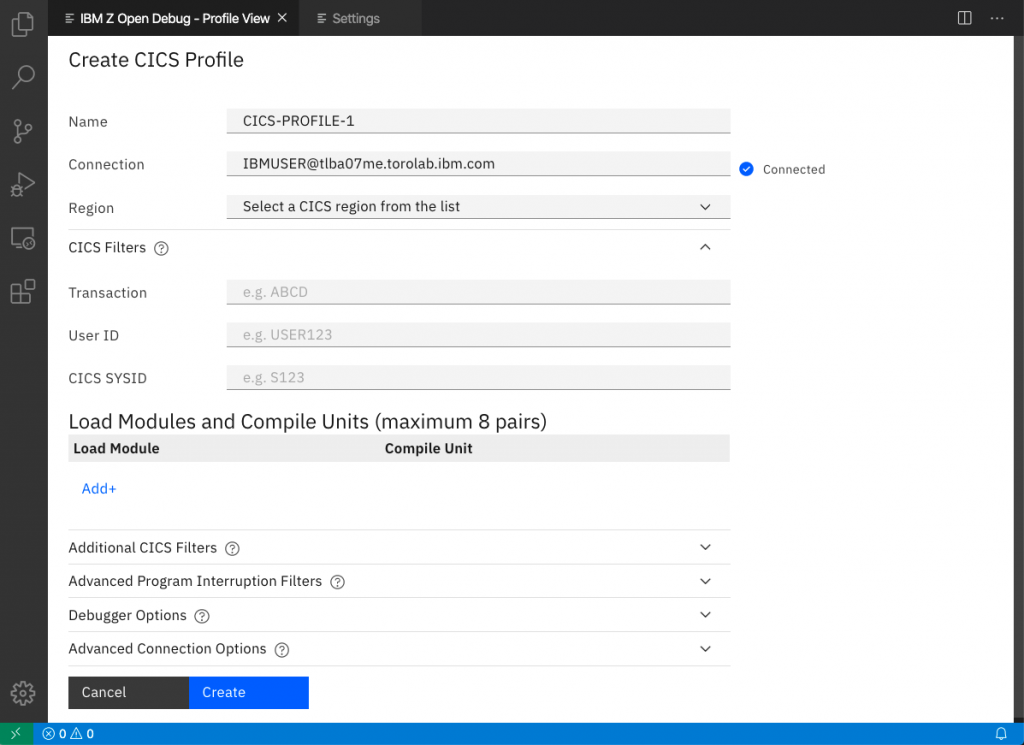
We not only group the fields but also provide tooltip assistance in most fields, to eliminate the need for reference guides.

How to connect to a Debug Manager ?
Ask no more! Our Debug Profile Service will automatically detect the information and configure it for you.
Read more about
Creating a debug profile for CICS application and
Creating a debug profile for a non-CICS applicationOur new extensions are powered by the Debug Profile Service that allow our Z Open Debug Visual Studio Code extensions to manage the profiles on a z/OS host.
- For CICS profiles, simply select the region for the profile from the pull-down list
- For non-CICS users, the extension can obtain the data set EQAOPTS file information from the Debug Profile Service.
If you are interested, you can read more about Debug Profile Service
here.
We provide you with the status of your connection to Debug Profile Service with the help of this connection label

Can I create the profiles offline ?
The answer is YES! You don't need to worry about providing the password to create your profiles. Our Z Open Debug - Profile View is integrated with VS Code's local storage to store your profiles offline. You can save as many profiles you wish to use later.
Activating your profile
Activating the profile is a one-click process. I mean literally ONE click.
Once a profile is created, the profile can be activated with the toggle.

Now you will be prompted to enter your z/OS host connection password.
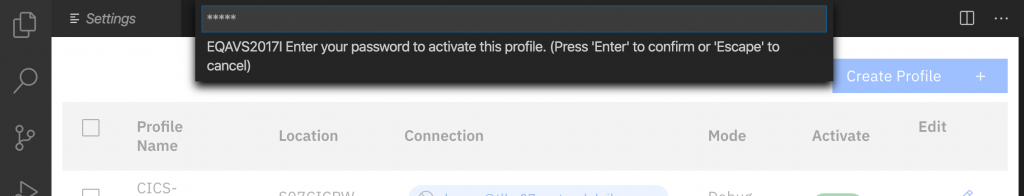
We also provide you with immediate response about the number of attempts remaining in case of an incorrect password. Type in your z/OS connection password and your profile will be activated and your application is ready to be debugged.
Learn more about
Launching your application and
Debugging your application
Going forward
We are excited about bringing the z/OS debugging experience into Visual Studio Code, as we believe it will simplify the way you manage your z/OS debug profiles. Our
Z Open Debug extension is just the first step to provide z/OS users with a new debugging experience in Visual Studio Code.
Please try out the new
Z Open Debug and Z Open Debug - Profile View extensions for Visual Studio Code.
As always, we are eager to hear your feedback. So don’t hesitate in reaching out to us and tell us what you would like to see!
We are always looking for ways to improve our extension. Follow us for more updates.
Happy Debugging!
