IBM Z Open Debug is a set of Visual Studio Code extensions providing debugging support for COBOL and PL/I applications in VS Code, in conjunction with two following IBM z/OS Debugger components on z/OS host:
Debug Profile Service, to manage debug profiles that determine how applications or transactions will be debugged.
Remote Debug Service, to provide interactive debugging capabilities with VS Code.
Prerequisites
- Install and configure VS Code
- Access to a z/OS host with IBM z/OS Debugger v14.2.3 installed and configured, including Remote Debug Service and Debug Profile Service
Installation
- Download and unzip the Wazi Development Client that contains two IBM Z Open Debug VS Code extension files( zopendebug-profile-ui.vsix and zopendebug.vsix ) from Mainframe Dev Center

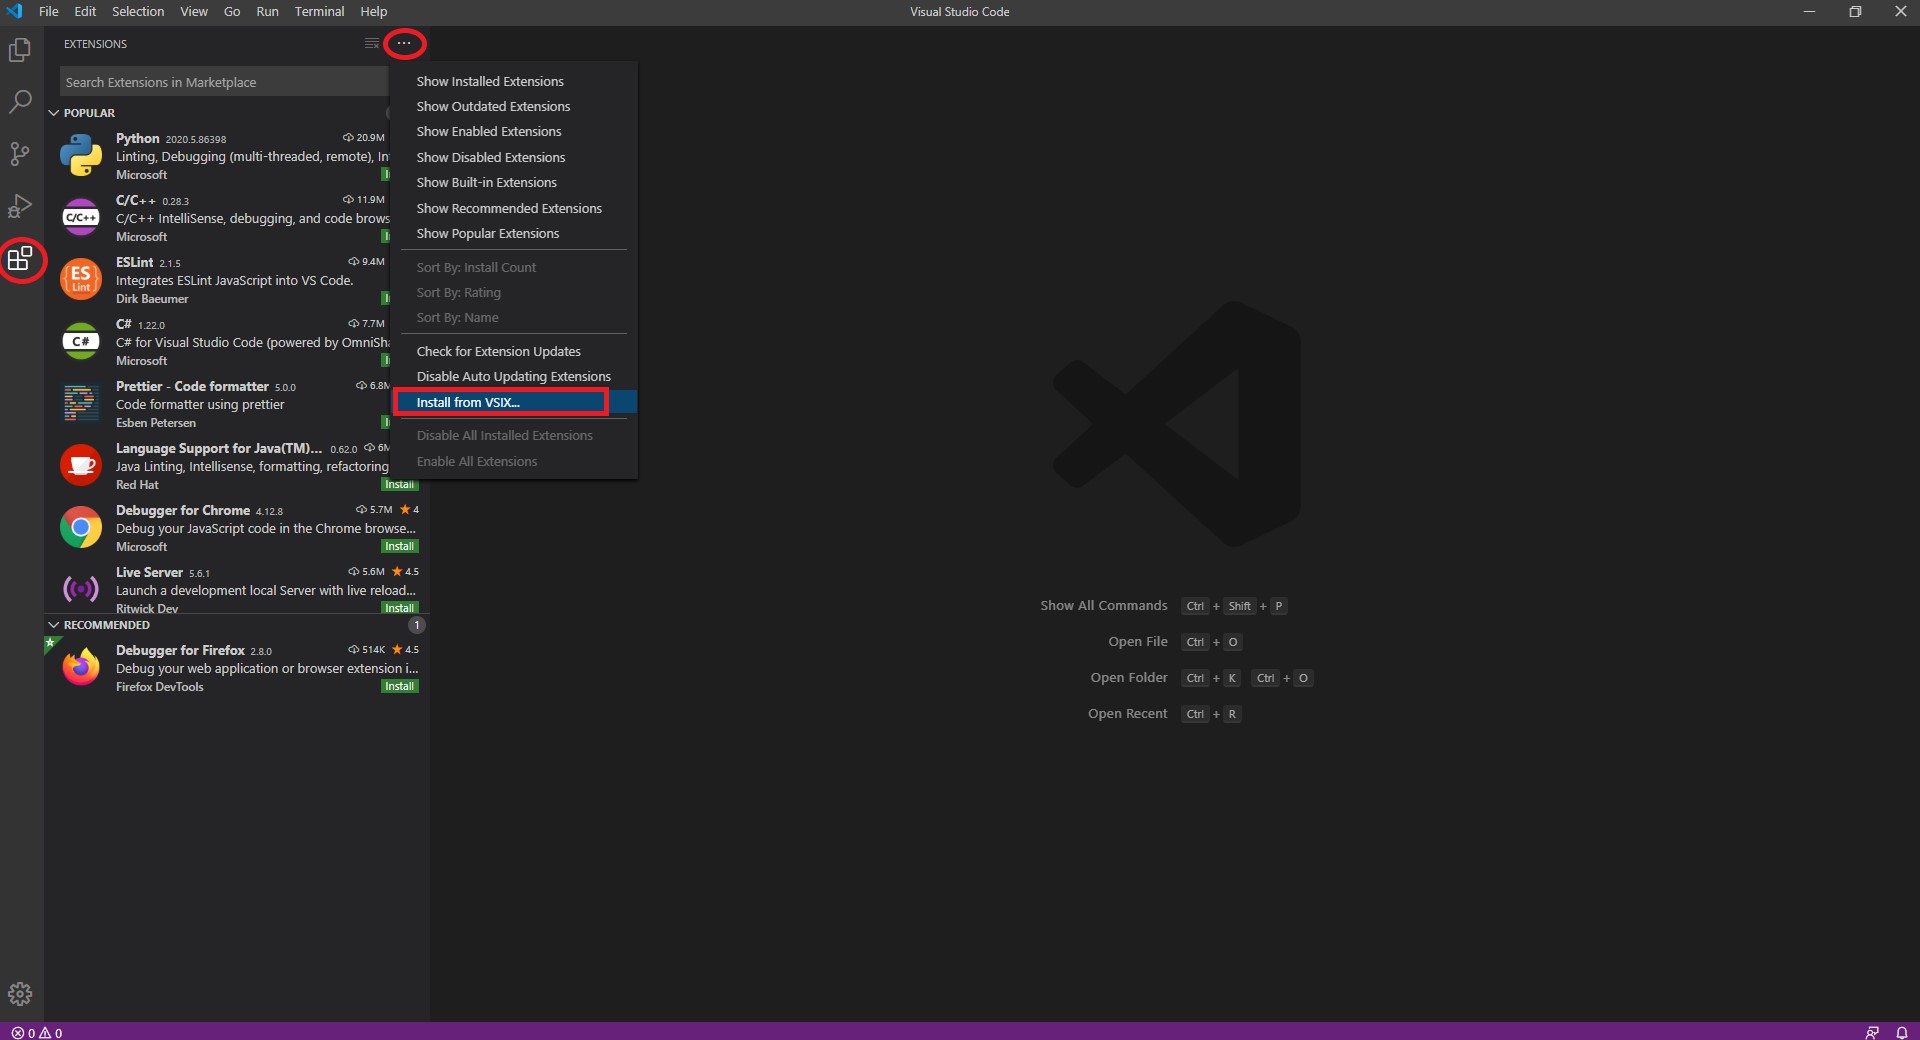
- Open the Extensions view inside VS Code
- Click on ' … ' icon and select ' Install from VSIX... ' from the list
- Install zopendebug.vsix first
- Repeat the step to install zopendebug-profile-ui.vsix
Creating a debug profile for a non-CICS application
Before creating profiles, you need to customize workspace settings based on your personal preference or organization standards. Open the VS Code Settings view, click on the entry IBM Z Open Debug and fill in:
- Your z/OS host name as the z/OS Debug Profiles > Connection Name
- Your remote debug profile service port number as the z/OS Debug Profiles > Connection Port
- Your z/OS user id as the z/OS Debug Profiles > User Name
- Select or deselect the Enable a secure connection checkbox

To debug a non-CICS application, you must create and activate a non-CICS profile which describes how debugger will be triggered.
- Open the z/OS Debug Profiles view using using View > Command Palette... > Debug: Z Open Debug Profiles
- Dismiss the welcome page if it is shown
- Click on the Create Profile button and select Batch, IMS, DB2. The non-CICS profile editor will be displayed
- Click the Add+ button and enter Load Modules and Compile Units inside editor
- Click Create to create the debug profile
- The new profile should appear in the z/OS Debugger Profiles list/table view
- Click the slider in the Activate column to activate the profile. Now, the non-CICS application will be debugged when it is launched with the appropriate runtime options to enable z/OS Debugger. For reference, see TEST runtime options and Simple TEST option

See
Supercharge your Debugging experience with Z Open Debug – Profile view and Visual Studio Code for more details related with debug profiles.
Launch your application
Log into your z/OS host machine and launch your non-CICS program with debug mode, the details of this steps might differ based on your environment and settings.
Debug your application
Configure your debugger
- Click the
 icon inside activity group
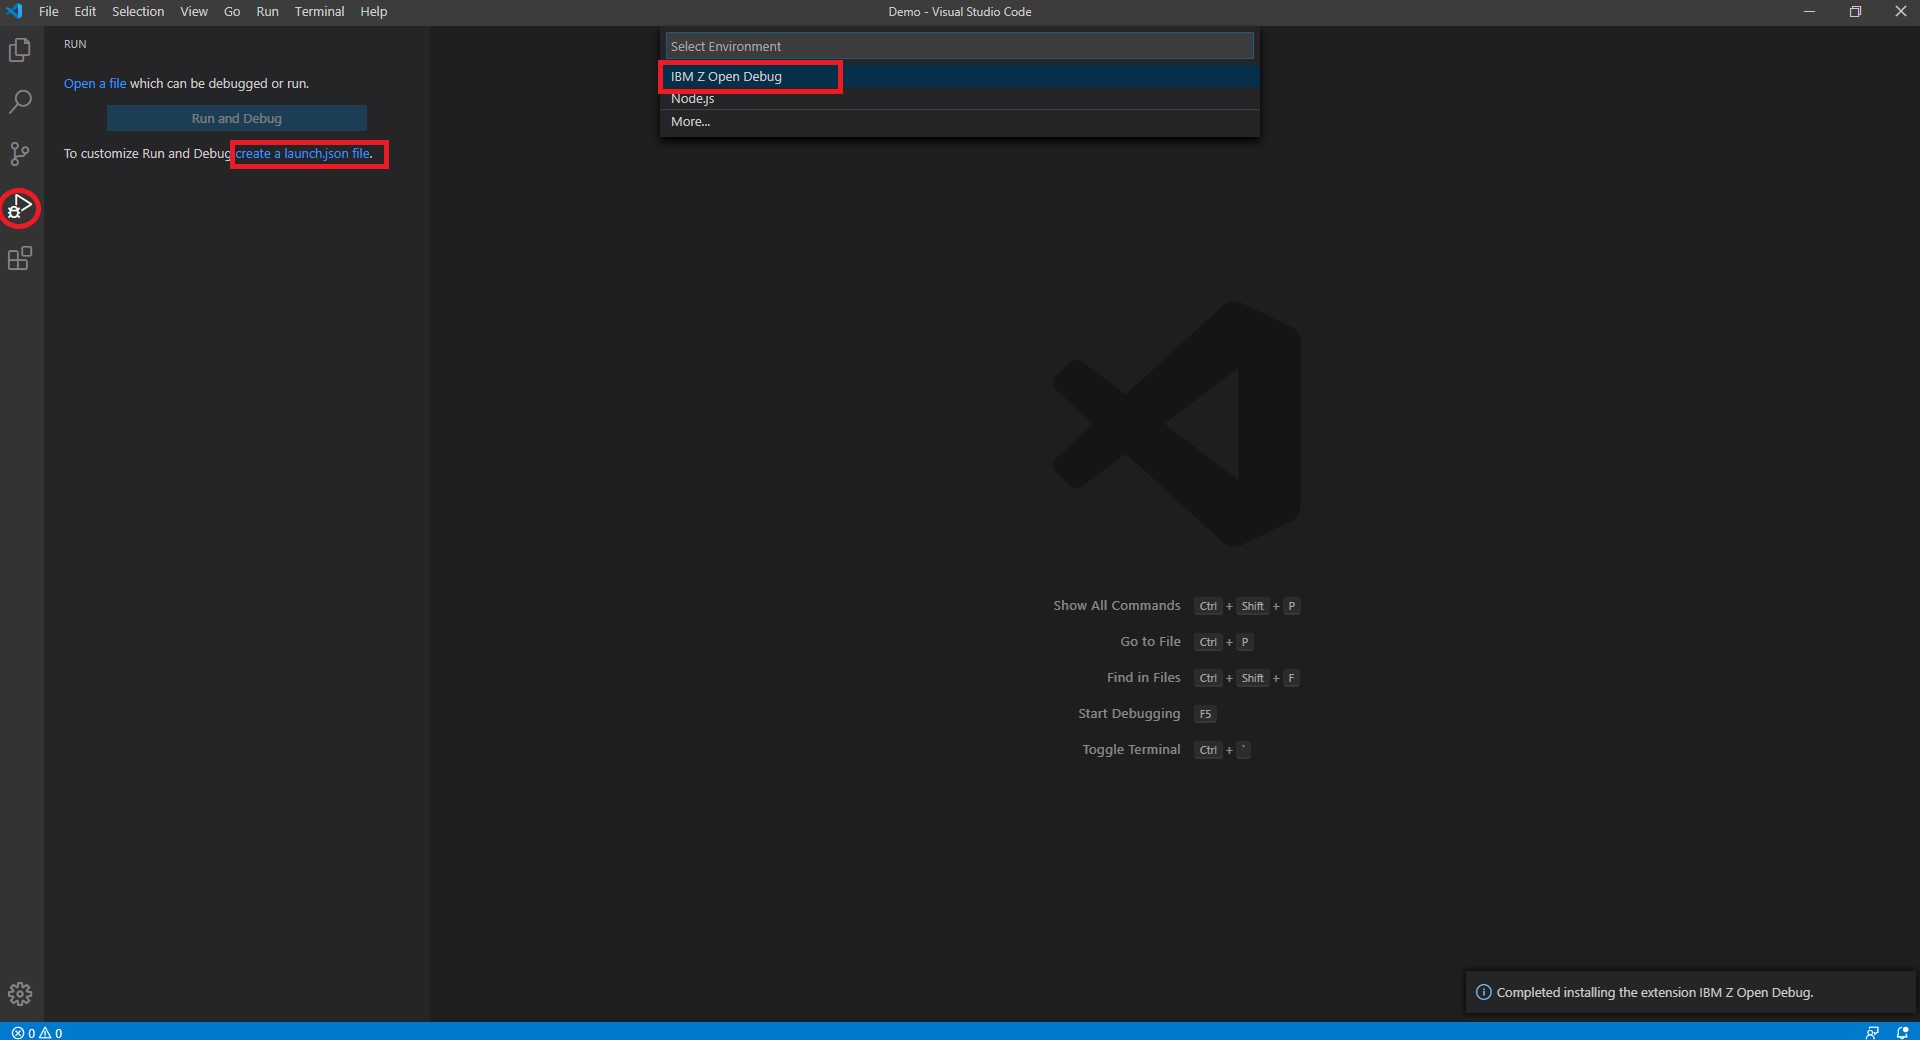
- Click ' create a launch.json file ' to add new configurations
- Select ' IBM Z Open Debug ' from the options VS Code prompts
- Predefined debug configurations will be added
By default, IBM Z Open Debug reuses the connection settings inside VS Code Settings and provides two different configuration types for working with z/OS Debugger sessions, please refer
Setting up for IBM Z Open Debug and
IBM Z Open Debug Profile for more details.
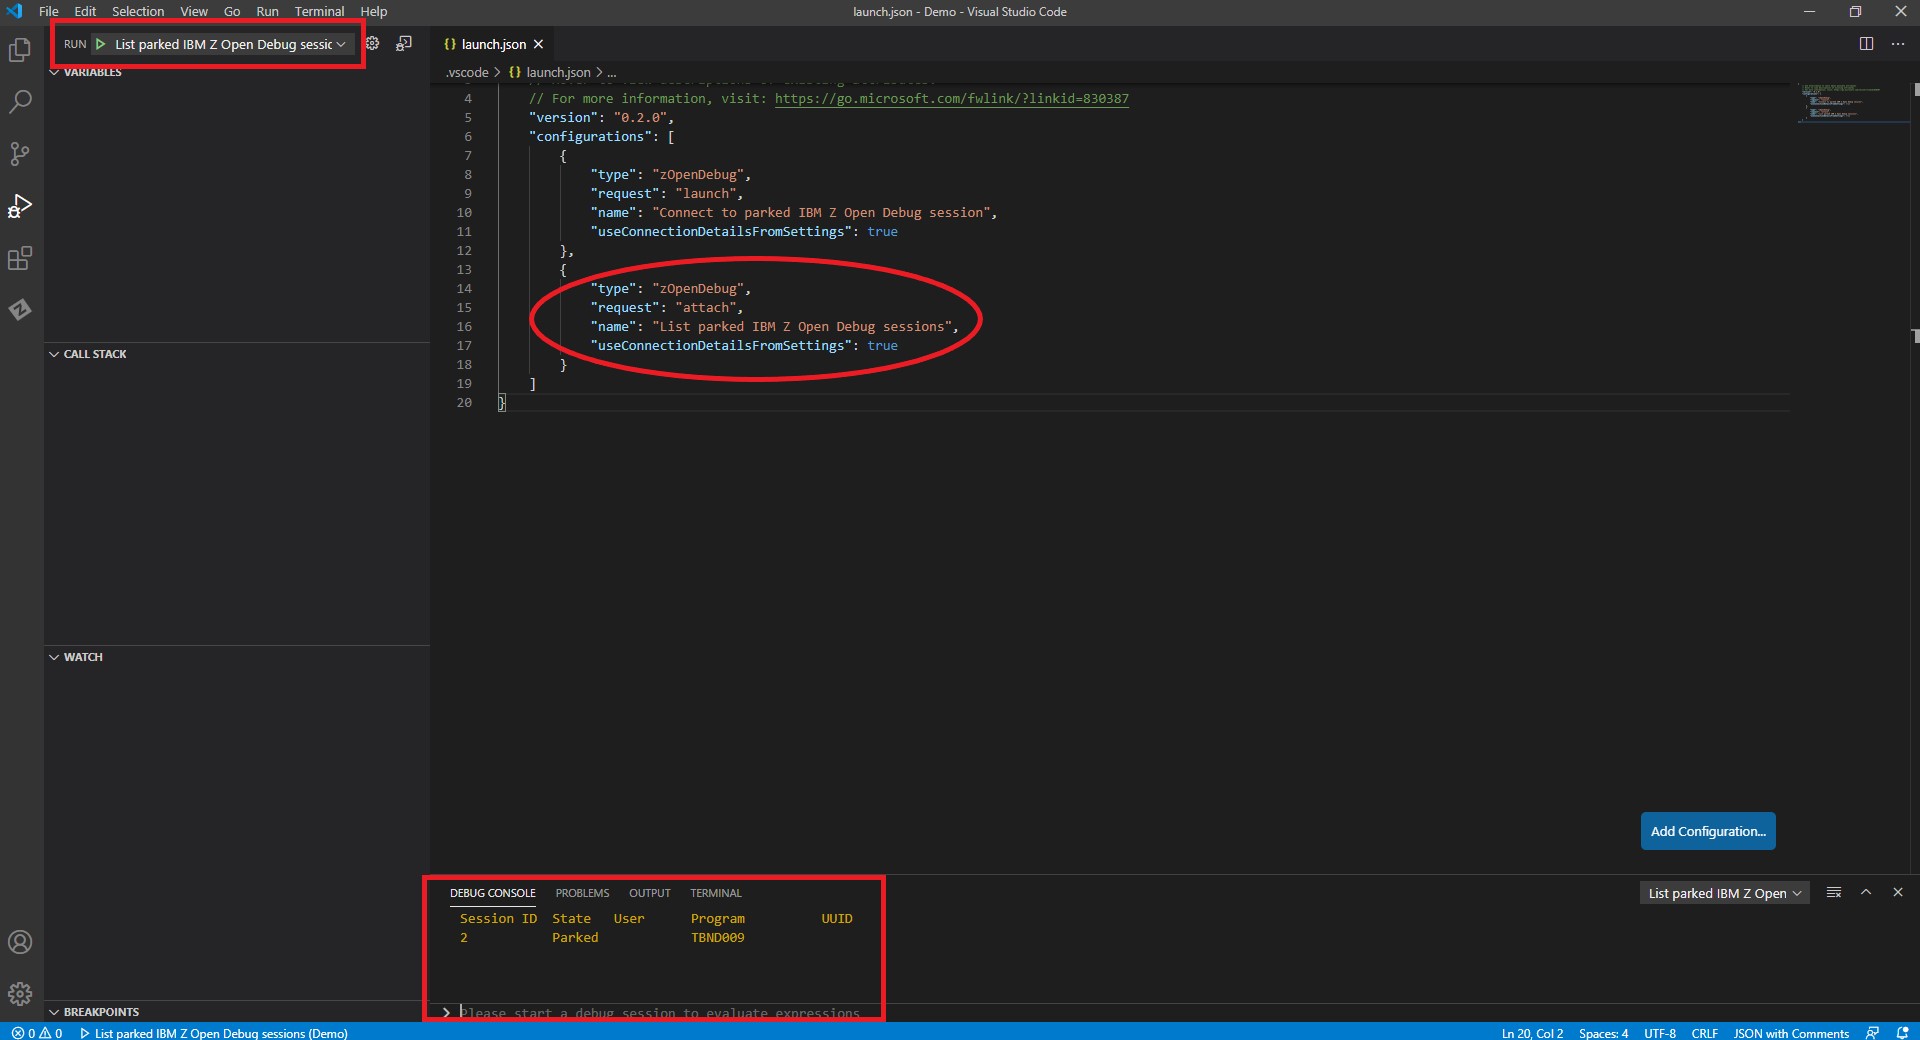
List parked IBM Z Open Debug sessions
Moving on, after proper configuration and launching your application in debug mode and parking it with Remote Debug Service, you can check all active sessions by run with debug configuration: List parked IBM Z Open Debug sessions. You should be able to find all parked Z Open Debug sessions in DEBUG CONSOLE. In DEBUG CONSOLE section, it will list some general information including Session ID, State, User, Program and UUID
Connect to parked IBM Z Open Debug session
Next, you can connect to a parked z/OS Debugger debug session on a z/OS host and start debugging it in VS Code by running with debug configuration: Connect to parked IBM Z Open Debug session. Once connected, the Z Open Debug user interface allows for interactive debugging of the application.
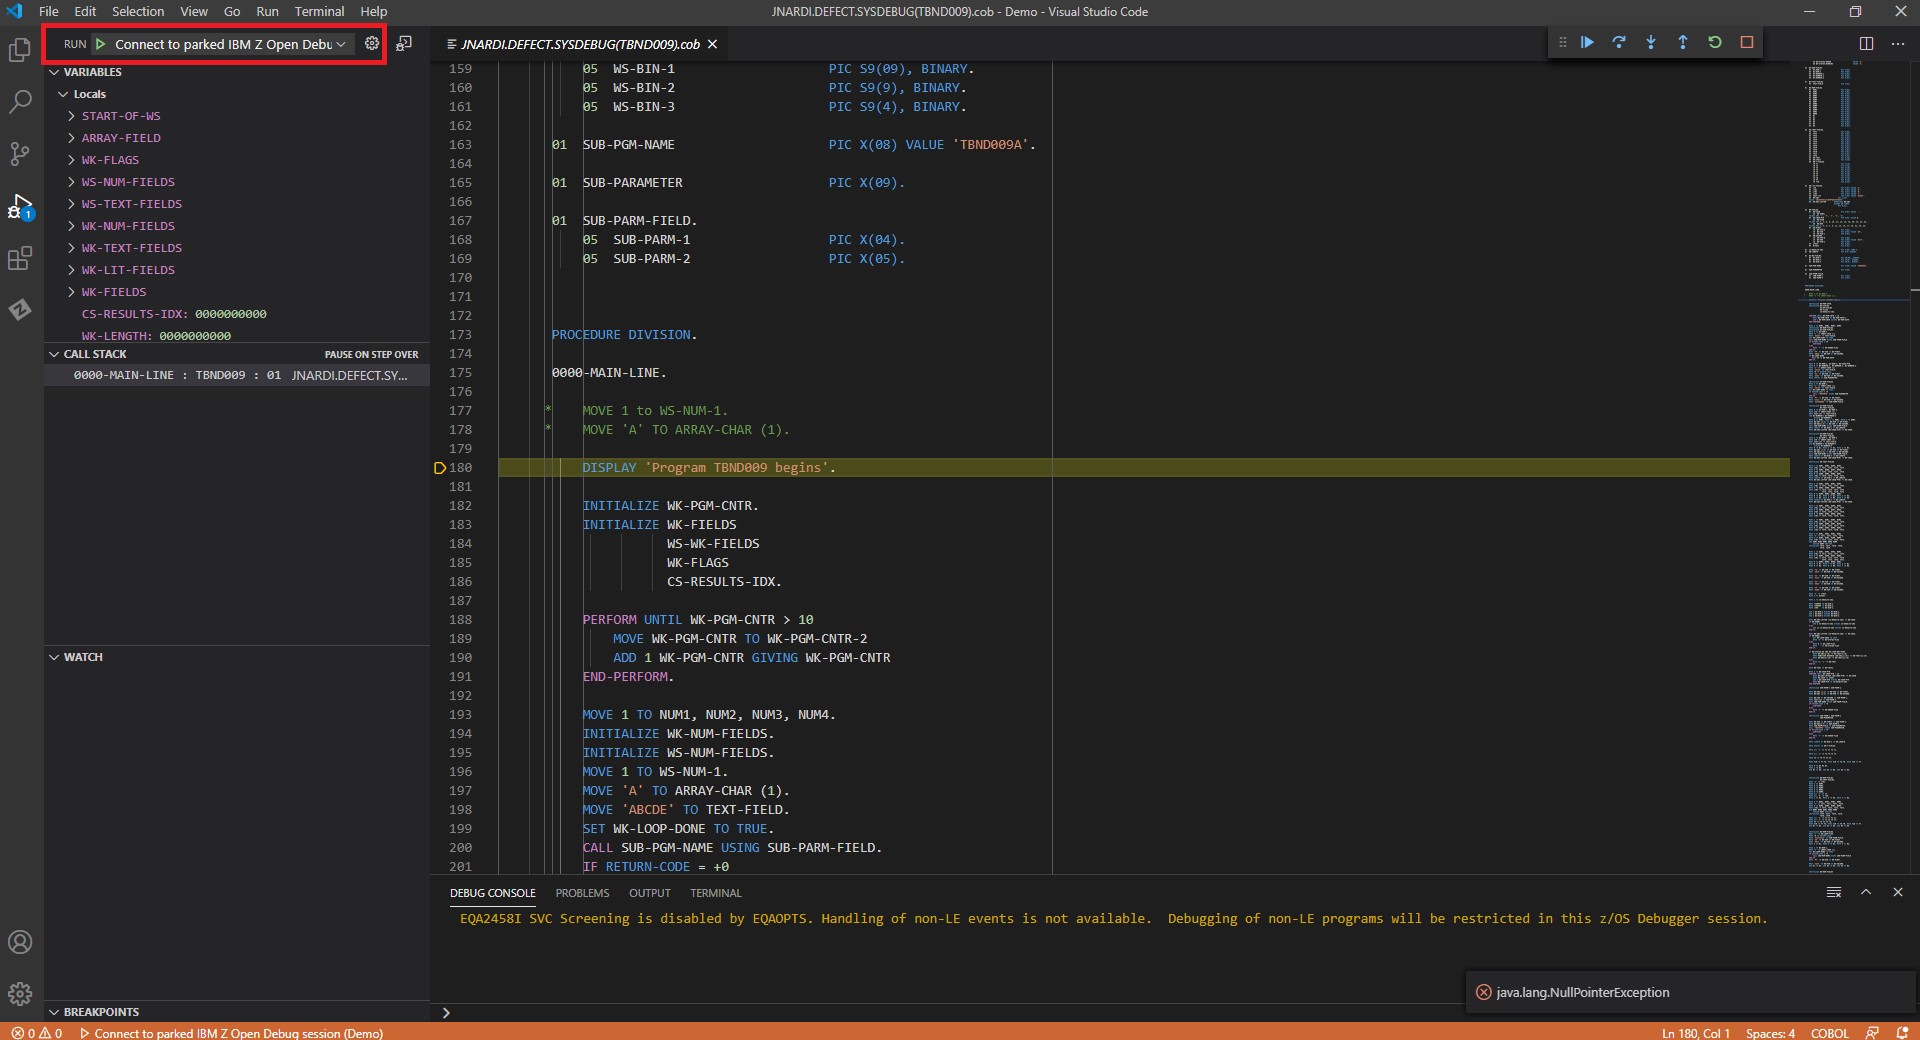
Like other debugging tools, you can step through a running program, watch monitored variable, and locate the bug bothering you. One thing to note here, not all VS Code debug features are currently supported by Z Open Debug. See
Remote Client Debug Feature Comparison Table for more details.
Have fun and Stay tuned!