This article was written by James Cancilla.
The AnomalyDetector operator in the time series toolkit can be an invaluable tool for detecting anomalies in real-time. If you are not familiar with the AnomalyDetector operator, please take a look at this article first: Anomaly Detection in Streams. In summary, this operator works by comparing the current time series data with a reference pattern (the reference pattern is updated based on a recent history of input time series). The more the current time series pattern diverges from the reference pattern, the more anomalous the current pattern is.
When dealing with time series data that is seasonal, detecting anomalies can be difficult. Let’s take the following example:

The above graph contains seasonal time series data, with each season having the same general shape. As the graph indicates, there is an unexpected spike (i.e. an anomaly) at t=126. This spike may actually be a useful data point and it would be helpful if the AnomalyDetector operator could detect this. Unfortunately, by using the data as it is, the AnomalyDetector operator will not be able to definitively detect this spike. The following graph shows the anomalous scores returned by the AnomalyDetector operator. The higher the score, the more likely the data is anomalous at the given time.
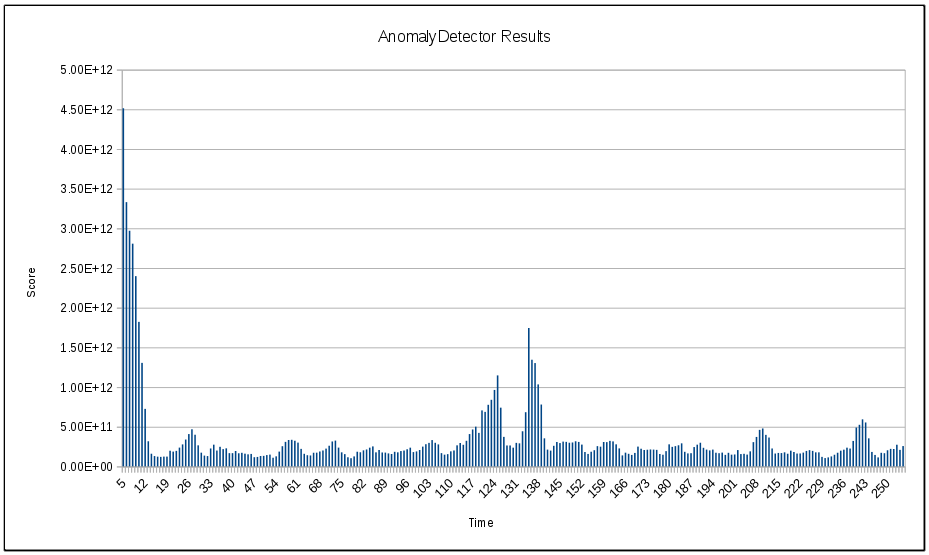
There are some interesting observations that from the above first. First, there are 3 larger spikes in the scores, which seems to indicate that multiple anomalies. The first spike is likely a false positive due to the fact that the AnomalyDetector has not yet had time to settle. The second spike does occur around t=126, which seems to indicate that the anomaly was detected to some degree. However, there is a third spike that occurs around t=135 and is actually larger than the spike at t=126. This third spike may be due to the fact that the anomaly at t=126 is now part of the reference pattern and so it’s causing data around t=135 to have a larger score.
Regardless of how you choose to interpret this graph, what is clear is that the AnomalyDetector was not able to definitively determine where the anomaly exists from the input time series graph. Now let’s look at one possible technique that can be used to aid in detecting the anomaly.
Decomposing the Time Series Data
When I originally tackled this problem, my first thought was “wouldn’t be great if I could somehow remove or flatten the seasons so that I was left with only the noise?” Thankfully, this is exactly what the STD2 operator in the time series toolkit does. The STD2 operator (which standands for Seasonal Trend Decomposition) is capable of decomposing a time series graph into three distinct components: season, trend and residual. The residual component is the time series with the season and the trend remove. For more information on how the STD2 operator works, take a look at the article Real-Time Decomposition of Time Series.
By streaming the original time series data through the STD2 operator and extracting the residual component, I get the following graph:
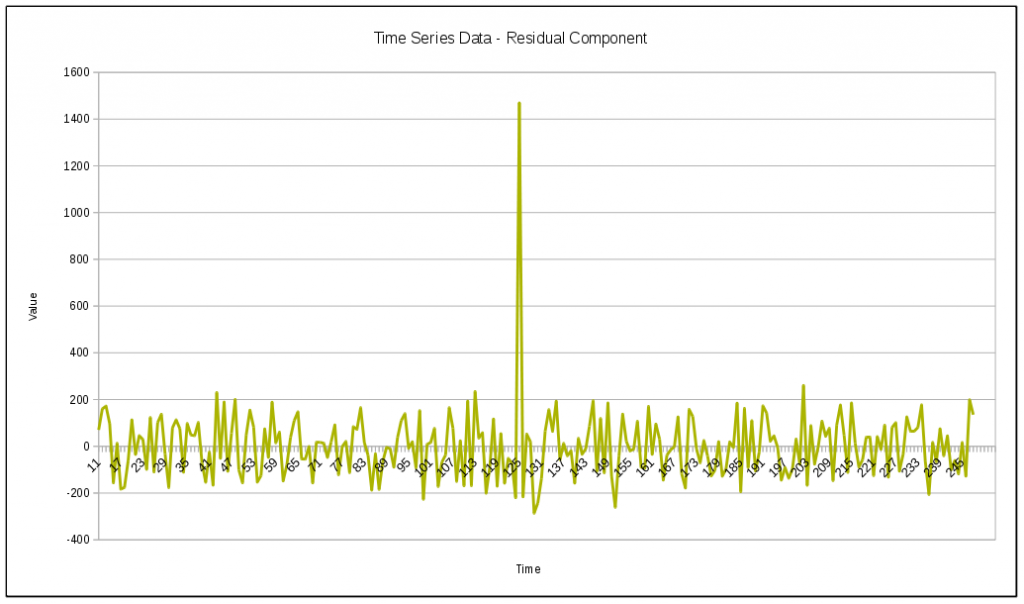
From this graph, it is very obvious that there is an anomaly at t=126. By using the residual component as the input to the AnomalyDetector operator, the operator should easily be able to to detect the anomaly from the above graph. Here is a graph showing the anomalous scores returned by the AnomalyDetector operator when using the residual values as the input:

As expected, the result of the AnomalyDetector clearly indicates that there is an anomaly around t=126. These results are far more definitive than the results I originally received when streaming the data directly into the AnomalyDetector operator.
For reference, here is what the graph of the SPL application that contains both the STD2 operator and AnomalyDetector operator. The source code for this application can be found in the STD2Samples project on GitHub, called “STD2Anomaly”.

Questions:
Reader asks,
I'd like to use this STD2 operator to analyze service call rate data. The data is collected in 1minute intervals and the seasonality is 1 week => 60247 = many data. Can i use this operator for large amounts of metrices or do i run out of memory? Why use the AnomalyDetector? The residualcomponent could Be compared to a threshold. Can You explain why the use of the AnomalyDetector is required. Thanks in advance.
Answer from James:
I expect the the operator to be capable of handling the data size you mentioned. I ran a quick test on my laptop using random data as the input. I set the seasonLength to 60247 and the numSeasons to 4. After running for a minute, the operator was using less than 100MB of memory. If you do run into any problems with memory, post the issue to the StreamsDev forum and I will be happy to look into it for you.
As for the use of the AnomalyDetector, you are correct in that a simple threshold on the residual data could have been used instead. I made the anomaly in this example blatantly obvious to ensure a good result from the AnomalyDetector and to make I was clearly conveying how to use the AnomalyDetector operator with the STD2 operator.
The link below shows another example whereby after extracting the residual component it is still difficult to determine when the anomaly occurred.
Click the image to expand.

The signal in this example is a sine wave with +/- 5% random noise added to it. Between t=200 and t=300, I set the random noise to +/- 7.5%. You can kind of see this in the graph of the residual component, however it’s not immediately obviously. I also suspect that picking an appropriate threshold on the residual data would be challenging. Setting a threshold value equal to 10 would result in some alerts but you may miss the fact that the anomaly occurred continuously between t=200 and t=300. Setting the threshold lower around 6 or 7 will likely result in a higher number of false-positives.
By using the AnomalyDetector (bottom graph), you can clearly see that something anomalous is happening between t=200 and t=300. Furthermore, picking a value for the threshold on the AnomalyDetector result is easier and will likely lead to more true-positives.
At the end of the day, it really comes down to experimentation to determine what the best tools for the job will be. If you expect to see obvious anomalies or peaks like in the article, then I would stick with using a simple threshold rather than adding the overhead of another operator. However, if your anomalies are less obvious or you are seeing a high number of false-positives when using a threshold on the residual data, then the AnomalyDetector operator may be able to help.
#CloudPakforDataGroup