This tutorial was written by Kalvin Misquith.
About this tutorial
In this tutorial, we will take a look at the Streams Console that enable you to build highly configurable dashboards geared towards your applications. The best way to explore these features is through example. I will deploy a few applications onto my domain and then create a dashboard which focuses on the data, health and performance of these applications.
Upon completion of this tutorial, you will know how to:
- Create dashboards
- Set dashboard filters
- Add new cards to your dashboard
- Create and use derived metrics
- Create and use queries to define a filter and the data backing the visualizations.
- Create and monitor data from views
Setup instructions
To setup a streams environment similar to one in the tutorial, you will need to perform the following steps:
- Create an instance called “StreamsInstance” if it does not exist. (Skip this step if you are using Streams in IBM Cloud or IBM Cloud Pak for Data, the instance has already been created.)
- Create a Job Group called “stockjobs” in the instance.
- Deploy the applications used in this tutorial. The applications can be downloaded from here. Once compiled, you can launch the application from the console by clicking on the submit job button located at the top of the page:
All applications should be submitted to the “stockjobs” job group in the instance “StreamsInstance”. The applications should have the following configuration:
| Application Name |
Job Name |
Submission parameter value |
| IndexAnalyzer |
IndexAnalyzer |
(none) |
| TradeSource |
TradeSource |
(none) |
| IndexCalculator |
IndexCalculator-IBM |
IBM |
| IndexCalculator |
IndexCalculator-EVG |
EVG |
| IndexCalculator |
IndexCalculator-BK |
BK |
The Applications
The applications I will use in this tutorial are a slight modification of the Vwap sample and are described below:
- TradeSource: Periodically exports trade quotes from a file.
- IndexCalculator-{stock}: Imports trade quotes from the TradeSource application and calculates the bargain index for a particular stock. The ingest operators in this job have a tag ‘ingest’. We will submit three of these applications, each of which will calculate the bargain index of a particular stock.
- IndexAnalyzer: Imports bargain indexes from the IndexCalculator-{stock} applications and calculates the average bargain index for all stocks. The operator which calculates the averages has an annotation which defines a view (For more information about view annotations, see the documentation.
After submitting these applications, my instance has a total of 10 jobs running on it — The five jobs detailed above (TradeSource, IndexCalculator-IBM, IndexCalculator-EVG, IndexCalculator-BK & IndexAnalyzer) which are under the job group “stock jobs” as well as five unrelated jobs:
Create Dashboards
Lets create a new dashboard for our applications:
1) Click on the dashboard button on the top banner to bring up the dashboard menu options. Click on the Create Dashboard option.
2) In the Create Dashboard dialog, type in the dashboard name ”Bargain Index Dashboard”. Lets use the default option of creating a dashboard with a default set of cards and a three column card layout. Click on the Create button.
A new dashboard called ”Bargain Index Dashboard” is created and displayed. Dashboards in the console are always private so other users will not be able to view this dashboard. You can share copies of your dashboards with other users through the export/import feature.
The filter of the new dashboard is set to the default “My Jobs” which shows all the jobs which I have submitted. This filter is too inclusive since our dashboard is cluttered with jobs we do not care about. Let’s change the filter so that the dashboard only show jobs from the trading application.
3) Click on the filter button on the top banner to bring up the Set Dashboard Filter dialog.
4) The queries tab in the Set Dashboard Filter dialog shows us all the available queries. When we assign a query as a filter, a job is allowed to pass the filter and show up on the dashboard only if the query produces a result when run against the job. Since the “My Jobs” query is currently assigned as our dashboard filter, jobs submitted by other users will not show up on our dashboard. Lets create a new query which produces only the jobs from our trading application. Click on the new query button to bring up the New Query dialog.
6) The manage queries dialog will appear listing the new query “Trading Applications”. The query dialog lists the rules which define the query as well as a result tree on the right which shows the objects produced by the query. An object must satisfy at-least one rule to be included in the result set. A rule consists of one or more conditions which define properties an object must have. For a rule to be satisfied, all conditions within it must be satisfied. To summarize: rules have a logical OR relationship and conditions within a rule have a logical AND relationship. Lets change the job group from “default” to “stockjobs”. The query now produces only jobs from the trading application.
7) The above query can be used as a filter in our scenario. But this was too easy, so lets assume we cannot rely on the “stockjobs” job group as a criteria in our filter. Change the condition property from “job group” to “job name”. Leave the condition operand as “equals”.
8) In the property value select box, select “IndexAnalyzer” and “TradeSource”. Our query should now produce two jobs IndexAnalyzer & TradeSource.
9) To include the IndexCalculator-{stock} jobs, we have a couple of options. We can include them by “job name” but if we decide in the future to change the stocks or add more IndexCalculator-{stock} jobs, we would need to modify the query. A more flexible option is to use the “application name” or change the operand to “starts with” to look up the job name prefix “IndexCalculator-“. But if we take advantage of the fact that the IndexCalculator jobs contain operators which have a unique tag “tradeingest”, we can ensure other applications which have this tag are automatically included in our dashboard. Click on the Add Rule link.
10) In the condition panel of the new rule, set the property to “operator tag”. Leave the condition operand as “equals”.
11) In the property value select box, select “tradeingest”.
12) Lets ensure that the applications which have the “tradeingest” tag are running in the instance “StreamsInstance”. Add another condition with the criteria “instance name” equals “StreamsInstance”,
13) The query result tree now shows the five jobs from the trading application. An object will be included in the query’s result set only if it satisfies the following logical criteria:
(Job name == “IndexAnalyzer” OR Job name == “TradeSource”)
OR
((Operator Tag == “tradeingest”) AND (Instance name ==”StreamsInstance”))
14) Click Save Query and close the manage query dialog.
15) On the Set Dashboard Filter dialog, select the “Trading Applications” query and click “Set Filter”. The “Bargain Index Dashboard” now only contains jobs from our trading application.
Add Cards
Lets add some cards to the Bargain Index Dashboard to help monitor the application. We will add a line chart which shows us the flow rate of tuples being submitted from our ingest operators (i.e. the operators which have the tag “tradeingest”).
1) Click on the add card placeholder (which appears as a card on the dashboard with a ‘+’ icon) to bring up the Add Card dialog
2) In the Card Title field type in “Ingest Flow Rates”
3) Click on the add button next to the query field to create a new query.
4) In the New Query dialog, type “Ingest operators” in the Query Name field and click OK.
5) In the Manage Queries dialog, change the condition property to “Operator tag” and set the value to the “tradeingest” tag. Verify that the operators which have the tag ‘tradeingest’ appear in the query result tree. Click on Save Query button.
6) In the Add Card dialog, change the visualization to “Line chart”
7) Switch to the Visualization Settings tab. set the Element type to “Operator output ports” and the Y-axis to “tuplesSubmissionRate”. By default, the X-axis for this chart is the time the metric was updated. You should be able to preview the “Flow rate chart” on the right panel.
8) Click on the Add button to add the card to the dashboard.
Derived Metrics
Each PE has a system metric “nCpuMilliseconds” which tells us the total amount of CPU time in milliseconds used by the PE. For our next card, lets create a bar chart which shows us the rate at which PEs are utilizing CPU time; i.e. the rate of change of “nCpuMilliseconds” per second.
1) Click on the the “Add card” button.
2) In the Card Title field type in “Rate of PE CPU time usage”.
3) We will make the bar chart show us the CPU time usage of all PEs available in the dashboard. Set the query to “All Jobs”.
4) Set the Visualization to “Bar Chart”.
5) From the visualization preview, we can see that a bar chart shows up with a default configuration where the x-axis shows resources and the y-axis shows us loadAverage metric. We need to change the configuration so that the x-axis shows PEs and the y-axis shows the rate of change of the nCpuMilliseconds metric. Click on the “Visualization Setting” tab.
6) Set the Element Type to PEs. The x-axis of the bar chart now shows PEs by ids.
7) The Measured By drop-down shows us the various metrics available for configuring the y-axis. A metric shows up in the Measured By list if it belongs to the object specified in the Element type field (in this case PE) or one of its children (in this case PE output port, PE input port, PE connections and operators). We do not want to use the system metric nCpuMilliseconds directly but instead we would like to use the rate of change of this metric. The derived metrics feature provides us with the capability to define new metrics whose value is based on performing some computation on a base metric. In this case the base metric is “nCpuMilliseconds” and the computation we would like to perform is the rate of change of the metric. Click on the derived metrics button located at the top of the Visualization Settings panel.
8) The manage derived metrics dialog lets us Add, Remove or modify a derived metric. The default derived metrics are tuplesSubmissionRate, tuplesProcessedRate and their byte equivalents. These default derived metrics tell us the rate at which data is submitted and processed by a port. Click on the New button
9) In the Create New Derived dialog, type in “PE CPU usage rate” and click OK.
10) Set the Metric Derived From field to “nCPUMillesconds”.
11) Set the Calculation applied to base metric “rate per second”.
12) The “Refresh every x seconds” field allows us to set the time after which the metric value needs to be re-calculated. Increasing the refresh interval is useful for cases where the metric does not significantly change often and we would like to wait for some time before performing the derived metric calculation. Note that the refresh interval is based on the update time of the metric and not on the time the metric is fetched by the console. Set the refresh interval to 1 second. Click Save and then Close.
13) In the Visualization Settings panel of the Add Card dialog, set the Measured By field to the PE CPU usage rate derived metric. In the Visualization Preview, you can see the desired bar chart. Click on the Add Card button to add the PE CPU usage rate bar chart to the dashboard.
14) In my case, I can see that one PE is utilizing much more CPU time than the rest of the PEs. By hovering on the bar, I can get all the information about the PE such as which operators are contained within it, which job the PE belongs to and which resource the PE is running on.
The operators contained within the PE are the FileSource operator TradeQuote and the export operator TradeExporter. Since the TradeQuote operator parses heaps of data from a file very often and the rest of the operators perform simple calculations, it makes sense for this operator to utilize relatively more CPU time.
Create Views
The application console supports displaying data captured through views in grids/tables as well as charts.
1) The IndexAnalyzer job contains a view which was defined by an annotation in the SPL code. Expand the views node of the tree displayed in the “Streams Tree” card to see the available views. The badge on the view node indicates the rate of tuples flowing through the view’s output port. Hover on the information icon on the view node to bring up a tooltip which contains details about the view and actions which can be performed on it.
2) Click on the Add View Grid action to add a new card to the dashboard which shows the data collected by the view.
The name of the card corresponds to the view name. If the job is cancelled and re-submitted with the same name, the view grid will automatically display data from the job’s view.
To observe the actual bargain index of the IBM stock, lets create a view on the output port of the export operator in the IndexCalculator-IBM’s job. The view can be created through the information tooltip of the output port or stream object. We will look at a couple of easy ways to locate the output port and stream.
Create a view by using the Streams Graph
1) Click on the maximize button on the Streams Graph so that it is easier to view. You will need to hover over the top right part of the card for the actions to appear.
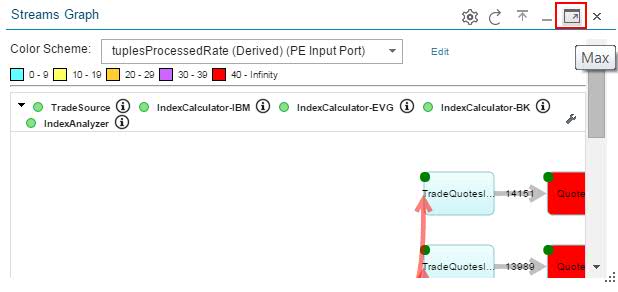
2) Locate the export operator of the IndexCalculator-IBM job. Mouse over the stream connecting the export operator to the import operator to bring up the information tooltip.
3) Click on the Create View action to bring up the “Create View” dialog. Lets accept the defaults and Click OK. A new card is added to the dashboard which shows data collected by the view.
Create a view by using search
1) Click on the search button on the top banner.
2) Change the scope to “Output Port”.
3) In the search field, type in the name of the output port “BargainIndex”. Mouse over the information icon to bring up the output port’s tooltip. Click on the Create view action to bring up the “Create View” dialog.
NEW IMG: images//bargainIndex.jpg
4) Alternatively, we can click on the name of the output port in the search box to make the streams tree auto-expand to the output port’s node:
Summary
In this tutorial, you created and configured a dashboard which focused on an a few jobs. You created a custom dashboard filter and saw how it can be used to reduce clutter on the dashboard by showing you only the jobs you are interested in. You added cards to your dashboard by creating queries, choosing visualizations and configuring the visualization. You defined new metrics on the fly by deriving their value from system/custom metrics. Finally you monitored the data flowing through the application by adding a view grid to your dashboard.
Useful Links
Download the application for this tutorial
This is an example of how to calculate your own metrics so they can be visualized from the dashboard.
Streams Knowledge Center
Streams Console overview
#CloudPakforDataGroup