Tutorial
Porting and tuning tools for Linux on Power
Discover powerful tools that can make a big differenceIntroduction
I had the good fortune to be selected to present at the OpenPOWER Summit US 2018 on the topic of tools for porting and tuning for Linux on Power. The time slots for the presentations were fairly short (maximum of 30 minutes), but there was a lot I wanted to cover. So, I did my best to highlight the tools I felt had the most value, and perhaps lacked general awareness. A video of the presentation can be found at https://www.youtube.com/watch?v=PJwnfDSHOLI. (There are lots of great presentations from the OpenPOWER Summit US 2018 appearing on the OpenPOWER Foundation's YouTube channel at: https://www.youtube.com/channel/UCNVcHm09eXVbvUzZkQs0_Sg.)
Instead of listening to me drone on for 30+ minutes, what follows is the basic content of the presentation in textual form, not verbatim and slightly more detailed - a better reference.
As a general note, I classify the use-cases for the tools in the following three ways:
 : The user has the source code available and is willing and able to change the source code for portability and performance advantage; the code can be recompiled and relinked; there is a representative performance scenario which can be run for analysis.
 : The user has the source code, but may not be willing or able to change it; the code can be recompiled or relinked; there is a representative performance scenario which can be run for analysis.
 : Source code is not required; neither recompiling nor relinking is required; there is a representative performance scenario which can be run for analysis.
Advance Toolchain
![]()
The IBM® Advance Toolchain is a software suite containing the latest releases of compilers, various libraries, and various tools related to application porting, tuning, and debugging. Recent releases of these components include support for the latest features and the latest optimizations for OpenPOWER and IBM Power® processor-based platforms. The purpose of the Advance Toolchain is to make these more modern software components available on distributions which only provide significantly older releases. The distributions, justifiably, are reluctant to change major components of the operating system like compilers and system libraries as the risk to stability is not worth the opportunity for better performance. Some distributions have made strides in providing developers with much more recent components as a developer toolset that provides a later compiler and its prerequisites. The Advance Toolchain goes farther in providing not only the latest compilers but also the latest releases of many system libraries. In addition, those system libraries are built with the latest compilers. In this way, applications built with the Advance Toolchain benefit not only from new optimizations in the latest software, but also by having that software compiled with the new compiler.
Further, the Advance Toolchain is where new compatibility features may appear first. For example, there is an ongoing effort under the auspices of the GCC project to provide compatible implementations of the Intel vector intrinsics. Those would not have appeared in major Linux distributions for a year or more, but have already appeared in the Advance Toolchain.
The Advance Toolchain is supportable through IBM Support Line. Updates with bug fixes and security-related fixes are released often. It is available for free download, and is entirely open source at https://github.com/advancetoolchain/advance-toolchain.
One caveat is that when an application is built with the Advance Toolchain, it then has a dependency on the Advance Toolchain runtime. So, if that application is to be deployed elsewhere, the Advance Toolchain runtime package must be installed there as well. Because the runtime is free, this is not of significant concern, but something of which to be aware.
Best practices:
- Better: At a minimum, use the latest of any distribution-provided developer toolset to get a recent release of the compiler.
- Best: Use the Advance Toolchain to get the latest release of the compiler, libraries, and tools; plus, those libraries built with the latest release of the compiler!
XL compilers
![]()
IBM XL compilers are IBM's flagship proprietary compiler suite, used for reporting SPEC benchmark results on IBM AIX®, IBM z/OS®, and Linux on Power. The IBM XL compiler development team works closely with the IBM Research team to incorporate the very best optimization techniques for performance advantage. Recently, the IBM XL C/C++ compiler switched to use a source code parser (front end) based on Clang, allowing the IBM XL C/C++ compiler to significantly improve source code compatibility with GCC and LLVM. Also, most common command-line options for GCC are also supported by the XL C/C++ compilers.
There are two variants of IBM XL C/C++ for Linux:
- Fully licensed
- Community Edition: A free, full function offering without support
The IBM XL compilers can very well make use of the Advance Toolchain libraries and tools. In a sense, you can get the best of both worlds by using IBM's flagship proprietary compiler with the latest fully optimized libraries. (Note that this will impose a dependency on the Advance Toolchain runtime.)
Listing 1. XL compilation using IBM Advance Toolchain libraries
$ xlc a.c -F /opt/at13.0/scripts/xlC-16_1_1-at13.0.dfp.cfg
Beyond standard compilation, the IBM XL compilers also offer several advanced features which can be used to performance advantage, one of which falls in the gray box category: automatic parallelization. If this is enabled using a command line option, code can be generated to automatically use the multithreading capabilities of the Power system for performance advantage.
![]()
The IBM XL compilers also include the following advanced features that can be used to further exploit the capabilities of the Power systems with source code changes:
- Transparent exploitation of GPU resources by taking advantage of the OpenMP 4.5 support
- High performance optimized math libraries (ESSL, BLAS)
- Optimization reports that can indicate areas of the code in which optimization opportunities could be increased with changes
Best practice:
- Try using the IBM XL C/C++ for Linux Community Edition. It is free, and its compatibility with GCC should make it a drop-in replacement simply by changing the PATH. If the performance advantage is significant, consider adopting the fully licensed and supported version for integration into a production build environment.
ma (Migration Advisor)
![]()
The command-line Migration Advisor scans the source code looking for likely portability issues. As of this writing, the list of checkers is slightly fewer for the command-line version:
#ifdef x86- Non-portable system calls, APIs, built-ins, assembly
long double, Float128- Non-portable hardware transactional memory use
chardefault signedness
Usage is very simple:
Listing 5. ma results
$ ma run src/.
================
Migration Report
================
Problem type: Non Portable Pthread
Problem description: Reports occurrences of non-portable Pthreads API
   File: ma/many.c
      Line: 3
      Problem: pthreadid_np_t tid


      Line: 4
      Problem: pthread_getthreadid_np()


   File: ma/pthread.c
      Line: 3
      Problem: pthread_id_np_t tid


      Line: 4
      Problem: pthread_getthreadid_np()


Problem type: Performance degradation
Problem description: This preprocessor can contain code without Power optimization
   File: ma/performance.c
      Line: 3
      Problem: #ifdef _x86


Problem type: Inline assembly
Problem description: Possible arch specific assembly
   File: ma/asm.c
      Line: 2
      Problem: asm("mov %ax, 0")


      Line: 3
      Problem: __asm__("mov %ax, 0")


Problem type: Long double usage
Problem description: Potential migration issue due size of long double variables in Power architecture.
   File: ma/t0.c
      Line: 3
      Problem: long double ld


   File: ma/double.c
      Line: 3
      Problem: long double ld


Problem type: Hardware Transactional Memory (HTM)
Problem description: x86 specific HTM calls are not supported in Power Systems
   File: ma/htm.c
      Line: 1
      Problem: include rtmintrin.h
      Solution: replace rtmintrin.h for htmintrin.h


      Line: 4
      Problem: _xbegin()
      Solution: replace xbegin for __builtin_tbegin


Problem type: Decimal Floating Point (DFP) API
Problem description: x86 API not supported in Power
   File: ma/dfp.c
      Line: 1
      Problem: include bid`functions.h


      Line: 6
      Problem:_bid64`pow(dfp0,dfp0)
The project is written in Python, is open source, and can be found at: https://github.com/open-power-sdk/migration-advisor.
cpi (CPI Breakdown)
![]()
The command-line CPI Breakdown tool will profile a representative performance scenario and report a hierarchical set of information about where the program is spending its time. Using the command-line CPI Breakdown tool is a two-step process:
record: Profile the performance scenario and record relevant hardware events.display: Display the collated results in the form of a hierarchical layout of events, metrics, and their respective relative contribution to overall CPI measurement.
Use of the command-line CPI Breakdown tool is simple. The first step is to record the hardware event counts.
Listing 7. cpi record
$ cpi record ./load
[…]
$ ls -tr | tail -1
load_20180416_215506.cpi
Note that the scenario ("./load" in this example) will be run several times in succession in order to collect all relevant hardware performance events, as only a handful are collected during each run.
The second step is to display the CPI breakdown.
Listing 8. cpi display results
$ cpi display -f ./load_20180416_215506.cpi
RUN_CPI: 4.957 (100.00 %)
  STALL_CPI: 2.270 (45.80 %)
    BRU_CRU_STALL_CPI: 0.277 (5.60 %)
      BRU_STALL_CPI: 0.277 (5.59 %)
      CRU_STALL_CPI: 0.000 (0.00 %)
    FXU_STALL_CPI: 0.707 (14.27 %)
      FXU_MULTI_CYC_CPI: 0.000 (0.00 %)
      FXU_STALL_OTHER_CPI: 0.707 (14.27 %)
    VSU_STALL_CPI: 0 (0.0 %)
      VSU_STALL_VECTOR_CPI: 0 (0.0 %)
        VSU_STALL_VECTOR_LONG_CPI: 0 (0.0 %)
        VSU_STALL_VECTOR_OTHER_CPI: 0 (0.0 %)
      VSU_STALL_SCALAR_CPI: 0 (0.0 %)
        VSU_STALL_SCALAR_LONG_CPI: 0 (0.0 %)
        VSU_STALL_SCALAR_OTHER_CPI: 0 (0.0 %)
      VSU_STALL_OTHER_CPI: 0 (0.0 %)
    LSU_STALL_CPI: 1.311 (26.46 %)
      LSU_STALL_DCACHE_MISS_CPI: 1.118 (22.56 %)
        LSU_STALL_DCACHE_MISS_L2L3_CPI: 0 (0.0 %)
          LSU_STALL_DCACHE_MISS_L2L3_CONFLICT_CPI: 0.876 (17.67 %)
          LSU_STALL_DCACHE_MISS_L2L3_NOCONFLICT_CPI: 0 (0.0 %)
        LSU_STALL_DCACHE_MISS_L3MISS_CPI: 0 (0.0 %)
          LSU_STALL_DCACHE_MISS_LMEM_CPI: 0 (0.0 %)
          LSU_STALL_DCACHE_MISS_L21L31_CPI: 0 (0.0 %)
          LSU_STALL_DCACHE_MISS_REMOTE_CPI: 0 (0.0 %)
          LSU_STALL_DCACHE_MISS_DISTANT_CPI: 0 (0.0 %)
      LSU_STALL_REJECT_CPI: 0.029 (0.58 %)
        LSU_STALL_LHS_CPI: 0.000 (0.00 %)
        LSU_STALL_ERAT_MISS_CPI: 0 (0.0 %)
        LSU_STALL_LMQ_FULL_CPI: 0 (0.0 %)
        LSU_STALL_REJECT_OTHER_CPI: 0.029 (0.58 %)
      LSU_STALL_STORE_CPI: 0.002 (0.04 %)
      LSU_STALL_LD_FIN_CPI: 0.470 (9.47 %)
      LSU_STALL_ST_FWD_CPI: 0 (0.0 %)
      LSU_STALL_OTHER_CPI: 0 (0.0 %)
    NTCG_FLUSH_CPI: 0 (0.0 %)
    NO_NTF_STALL_CPI: 0.012 (0.24 %)
    OTHER_STALL_CPI: 0 (0.0 %)
  NTCG_ALL_FIN_CPI: 0 (0.0 %)
  THREAD_BLOCK_STALL_CPI: 0.440 (8.87 %)
    LWSYNC_STALL_CPI: 0.001 (0.01 %)
    HWSYNC_STALL_CPI: 0.000 (0.00 %)
    MEM_ECC_DELAY_STALL_CPI: 0 (0.0 %)
    FLUSH_STALL_CPI: 0.442 (8.92 %)
    COQ_FULL_STALL_CPI: 0.000 (0.00 %)
    OTHER_BLOCK_STALL_CPI: 0 (0.0 %)
  GCT_EMPTY_CPI: 1.245 (25.13 %)
    GCT_EMPTY_IC_MISS_CPI: 0 (0.0 %)
      GCT_EMPTY_IC_MISS_L3MISS_CPI: 0 (0.0 %)
      GCT_EMPTY_IC_MISS_L2L3_CPI: 0 (0.0 %)
    GCT_EMPTY_BR_MPRED_CPI: 0 (0.0 %)
    GCT_EMPTY_BR_MPRED_IC_MISS_CPI: 0 (0.0 %)
    GCT_EMPTY_DISP_HELD_CPI: 0.000 (0.00 %)
      GCT_EMPTY_DISP_HELD_MAP_CPI: 0.000 (0.00 %)
      GCT_EMPTY_DISP_HELD_SRQ_CPI: 0 (0.0 %)
      GCT_EMPTY_DISP_HELD_ISSQ_CPI: 0 (0.0 %)
      GCT_EMPTY_DISP_HELD_OTHER_CPI: 0 (0.0 %)
    GCT_EMPTY_OTHER_CPI: 1.245 (25.12 %)
  COMPLETION_CPI: 0.384 (7.75 %)
  OTHER_CPI: 0.618 (12.46 %)
There is a lot of information displayed. For convenience, there are command flags which can limit the output.
Listing 9. cpi display with filters
$ cpi display -f ./load_20180416_215506.cpi --top-events 5
================
Events Hot Spots
================
    PM_RUN_CYC : 30007450676
    PM_CMPLU_STALL : 13742052138
    PM_CMPLU_STALL_LSU : 7939376272
    PM_GCT_NOSLOT_CYC : 7540013513
    PM_CMPLU_STALL_DCACHE_MISS : 6770379676


$ cpi display -f ./load_20180416_215506.cpi --top-metrics 5
================
Metrics Hot Spots
================
    RUN_CPI : 4.957
    STALL_CPI : 2.270
    LSU_STALL_CPI : 1.311
    GCT_EMPTY_CPI : 1.245
    GCT_EMPTY_OTHER_CPI : 1.245
Because the ultimate goal is to narrow down where in the code adverse events are happening, there is a further convenience function that can drill down on the most frequently occurring events. New profiling runs are launched in which those specific events are recorded and the profiling information, including source, line, and potentially instruction are included in the command output.
Listing 10. cpi drilldown results
$ cpi drilldown --auto 5 --threshold 0.25 ./load 2000
    Recording CPI Events: 20/20 iterations (elapsed time: 29 seconds)
    Running drilldown with event: PM_RUN_CYC


===============================
Drilldown for event: PM_RUN_CYC
===============================
99.51% in /home/pc/load-2.1pc/load
    99.51% in main [/home/pc/load-2.1pc/load.c]
===============================


    Running drilldown with event: PM_CMPLU_STALL


===================================
Drilldown for event: PM_CMPLU_STALL
===================================
99.07% in /home/pc/load-2.1pc/load
    99.07% in main [/home/pc/load-2.1pc/load.c]


0.9% in /proc/kallsyms
    0.63% in rfi_flush_fallback [??]
===================================


    Running drilldown with event: PM_CMPLU_STALL_LSU


=======================================
Drilldown for event: PM_CMPLU_STALL_LSU
=======================================
98.3% in /home/pc/load-2.1pc/load
    98.3% in main [/home/pc/load-2.1pc/load.c]


1.67% in /proc/kallsyms
    0.92% in rfi_flush_fallback [??]
======================================


    Running drilldown with event: PM_GCT_NOSLOT_CYC


======================================
Drilldown for event: PM_GCT_NOSLOT_CYC
======================================
99.03% in /home/pc/load-2.1pc/load
    99.03% in main [/home/pc/load-2.1pc/load.c]


0.94% in /proc/kallsyms
    0.47% in rfi_flush_fallback [??]
======================================


    Running drilldown with event: PM_CMPLU_STALL_DCACHE_MISS


===============================================
Drilldown for event: PM_CMPLU_STALL_DCACHE_MISS
===============================================
99.55% in /home/pc/load-2.1pc/load
    99.55% in main [/home/pc/load-2.1pc/load.c]
===============================================
The project is written in Python, is open source, and can be found at: https://github.com/open-power-sdk/cpi-breakdown
Note: Recent versions of the perf command can generate detailed CPI breakdown information:
$ perf stat --metrics cpi_breakdown ./command
The required hardware events are multiplexed during the run, so only a single run of the command is required, unlike with the cpi command. The output from perf is not as readable as with the cpi command:
    98,592,041,003      pm_cmplu_stall_lsu        #      0.2 lsu_stall_cpi            (1.62%)
   443,705,226,452      pm_run_inst_cmpl                                              (1.62%)
                 0      pm_cmplu_stall_mtfpscr    #      0.0 mtfpscr_stall_cpi        (1.61%)
   443,096,791,920      pm_run_inst_cmpl                                              (1.61%)
   287,059,677,642      pm_run_cyc                #      0.1 other_cpi                (2.40%)
   103,680,195,764      pm_1plus_ppc_cmpl                                             (2.40%)
   442,804,348,934      pm_run_inst_cmpl                                              (2.40%)
   287,062,495,146      pm_run_cyc                #      0.6 run_cyc_cpi
                                                  #      0.6 run_cpi                  (2.40%)
curt
![]()
There is a tool called curt on AIX that displays statistics related to system utilization. A new tool for Linux, also called curt is inspired by the AIX tool (but is otherwise unrelated).
Statistics reported by the Linux curt tool include:
- Per-task-per-CPU user, system, interrupt, hypervisor, and idle time
- Per-task, per-process, and system-wide user, system, interrupt, hypervisor, and idle time
- Per-task, per-process, and system-wide utlization percentage, and migration counts
- Per-task-per-syscall invocation counts, elapsed time, average time, minimum time, and maximum time
- Per-task-per-HCALL invocation counts, elapsed time, average time, minimum time, and maximum time
- Per-task-pre-interrupt counts, elapsed time, average time, minimum time, and maximum time
Use of the tool is a two-step process:
Use
perf recordto generate a recording of relevant events:$ perf record -e '{raw_syscalls:*,sched:sched_switch,sched:sched_migrate_task, sched:sched_process_exec,sched:sched_process_fork,sched:sched_process_exit, sched:sched_stat_runtime,sched:sched_stat_wait,sched:sched_stat_sleep, sched:sched_stat_blocked,sched:sched_stat_iowait,powerpc:hcall_entry, powerpc:hcall_exit}' -a command --argsUse the curt script to process the data recorded by the perf command:
$ ./curt.py perf.data
With the most recent version of curt, both recording and reporting can be done in a single, simple step: $ ./curt.py --record all command
Sample output (heavily edited for brevity and clarity):
Listing 11. curt results
PID :
5020:
  [task] command    cpu      user       sys       irq        hv      busy         idle
  [5092] imjournal    6  0.288924  0.154960  0.000000  0.000000  0.000000  5001.594250
  [5092] imjournal  ALL  0.288924  0.154960  0.000000  0.000000  0.000000  5001.594250


  [task] command    cpu   runtime     sleep      wait   blocked    iowait unaccounted
  [5092] imjournal    6  0.461900  0.000000  0.000000  0.000000  0.000000  997.568960
  [5092] imjournal  ALL  0.461900  0.000000  0.000000  0.000000  0.000000  997.568960


  [task] command    cpu util% moves
  [5092] imjournal    6  0.0%
  [5092] imjournal  ALL  0.0%     0


    ( ID)name  count      elapsed      pending      average      minimum      maximum
    (  3)read      6     0.041416     0.000000     0.006903     0.002252     0.022116
    (167)poll      4  4004.103382   997.585996  1001.025845  1001.018766  1001.029046
    (221)futex     1     0.011118     0.000000     0.011118     0.011118     0.011118
    (106)stat      1     0.007298     0.000000     0.007298     0.007298     0.007298


  [task] command    cpu      user       sys       irq        hv      busy         idle
  [5093] rs:main      7  0.093216  0.072478  0.000000  0.000000  0.000000  5001.872440
  [5093] rs:main    ALL  0.093216  0.072478  0.000000  0.000000  0.000000  5001.872440


  [task] command    cpu   runtime     sleep      wait   blocked    iowait unaccounted | util% moves
  [5093] rs:main      7  0.145840  0.000000  0.000000  0.000000  0.000000 5001.872440 |  0.0%
  [5093] rs:main    ALL  0.145840  0.000000  0.000000  0.000000  0.000000 5001.872440 |  0.0%     0


  [task] command    cpu util% moves
  [5093] rs:main      6  0.0%
  [5093] rs:main    ALL  0.0%     0


    ( ID)name  count      elapsed      pending      average      minimum      maximum
    (  4)write     1     0.036936     0.000000     0.036936     0.036936     0.036936
    (221)futex     1     0.002178  5001.905804     0.002178     0.002178     0.002178


  [task] command    cpu      user       sys       irq        hv      busy         idle
  [ ALL]            ALL  0.382140  0.227438  0.000000  0.000000  0.000000 10003.466690


  [task] command    cpu   runtime     sleep      wait   blocked    iowait unaccounted
  [ ALL]            ALL  0.607740  0.000000  0.000000  0.000000  0.000000 5999.441400


  [task] command    cpu  util  moves
  [ ALL]            ALL  0.0%   0
The project is written in Python, is open source, and can be found at: https://github.com/open-power-sdk/curt.
Power Functional Simulator
![]() ,
, ![]() , and
, and ![]()
The Power Functional Simulator is a full-system simulator for Power. This very powerful tool provides a complete Power environment when a Power processor-based system is otherwise unavailable or impractical. Given an image of an installed file system, it will boot through firmware and operating system to a login prompt for a Power processor-based development environment.
The Power Functional Simulator can be found at: https://developer.ibm.com/tutorials/download-and-install-sdk-for-lop/.
Convenient wrapper scripts, which greatly simplify getting an environment established, can be found at: https://github.com/open-power-sdk/power-simulator.
Listing 12. Power Functional Simulator boot
[x86-laptop]$ mambo -s power9  #(edited for brevity...)
You are starting the IBM Power9 Functional Simulator
When the boot process is complete, use the following credentials to access it via ssh:
ssh root@172.19.98.109
password: mambo
Licensed Materials - Property of IBM.
(C) Copyright IBM Corporation 2001, 2017
All Rights Reserved.
Using initial run script /opt/ibm/systemsim-p9/run/p9/linux/boot-linux-le-skiboot.tcl
Starting mambo with command: /opt/ibm/systemsim-p9/bin/systemsim-p9 -W -f
/opt/ibm/systemsim-p9/run/p9/linux/boot-linux-le-skiboot.tcl
Found skiboot skiboot.lid in current directory
Found kernel vmlinux in current directory
Found disk image disk.img in current directory
Booting with skiboot ./skiboot.lid.....
Booting with kernel ./vmlinux.....
root disk ./disk.img
INFO: 0: (0): !!!!!! Simulator now in TURBO mode !!!!!!
OPAL v5.7-107-g8fb78ae starting...
[...]
Linux version 4.13.0-rc4+ (pc@moose1.pok.stglabs.ibm.com) (gcc version 4.8.5 20150623 (Red Hat
4.8.5-11) (GCC)) #2 SMP Fri Aug 18
17:01:57 EDT 2017
[...]
Debian GNU/Linux 9 mambo ppc64le 172.19.98.109
mambo login:
The environment provided by the Power Functional Simulator is single core, single thread. There are simulators available for Power8, Power9, and Power10 processors. A simulator is a great way to begin getting experience with Linux on Power, beginning a porting effort, and even for establishing a robust cross-compilation and runtime environment.
Performance Simulator
![]()
The Performance Simulator is a cycle-accurate Power instruction stream reporting tool. It transforms a Power instruction trace into a report where the various stages of each cycle of every instruction's lifetime is reported. The resulting reports can be viewed with one of the viewers which is included with the Performance Simulator package.
Instruction traces can be captured using the itrace function of the Valgrind tool suite. Valgrind itrace is not included with the Valgrind that comes with Linux distributions. However, itrace is available with the Valgrind that comes with the IBM Advance Toolchain (see above).
Using the Performance Simulator is a three-step process:
Record instruction trace (
.vgifile):$ valgrind --tool=itrace --binary-outfile=tracefile.vgi --num-K-insns-to-collect=100 --demangle=no commandCreate a
.qtformat file from the.vgifile:$ vgi2qt -f tracefile.vgi -o tracefile.qtRun the Performance Simulator timer (
.pipefile):$ /opt/ibm/sim_ppc/sim_p10/bin/run_timer tracefile.qt 100000 10000 1 tracefile -scroll_pipe 1 -scroll_begin 1 -scroll_end 100000
You can view the resulting instruction timing report with the jviewer.
jviewer
![]()
The jviewer tool displays the instruction cycle report.
Figure 10. jviewer display
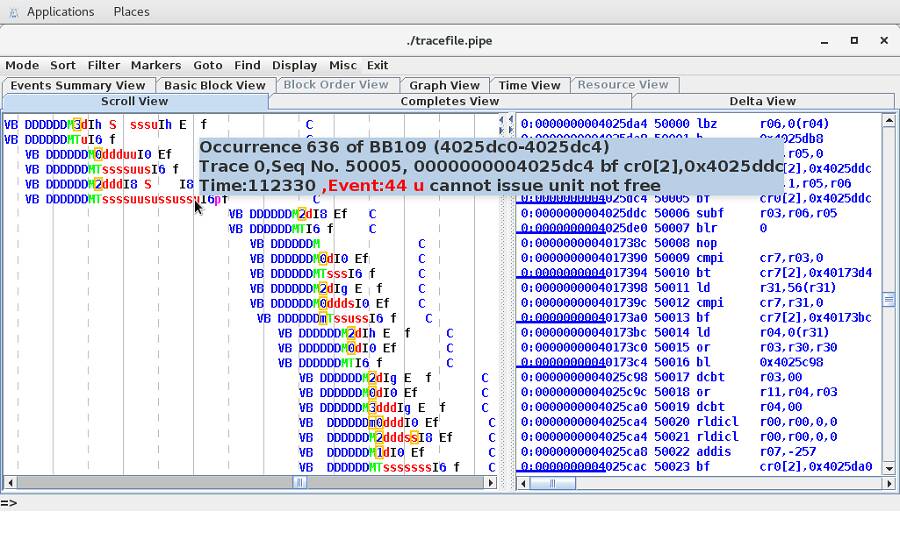
Each phase of each instruction’s lifetime is shown visually in the main pane, lower left. The instruction disassembly is in the rightmost pane. Hovering over any of the character mnemonics in the main pane will display more details about it. In the example, the cursor is over a ‘u’ near the center of the pane. The corresponding explanation is “cannot issue unit not free”. This instruction is currently waiting for the branch unit to be made available from the processing of a previously executed instruction.
pipestat
![]()
The pipestat tool operates on the output of the Performance Simulator cycle-accurate timer, and performs detailed analysis, reporting the following information:
- Most executed loops, including misaligned short loops
- Most executed blocks with long latency instructions, redundant loads
- Most executed incorrectly hinted branches
- Most executed mispredicted and frequently mispredicted branches
- Most executed code paths that have a store followed soon after by a load of the same address
- Most load-hit-store related events on a particular instruction address
- Most executed instructions where the result is used a small number of instructions later but takes a large number of cycles before the dependent instruction starts
The pipestat tool produces a lot of useful output. Extracted below are a few snippets.
Listing 13. pipestat results
HOT execution count blocks:
  0x000004025c98-0x000004025cac N:678 6 inst trace inst 297


HOT misaligned short loops:
  0x00000400ea58-0x00000400ea74 N:170 8 inst short misalign32
Loop size summary data:
Instrs  loops  total iter  min iter  max iter  avg iter  total inst  % of trace
   6        1         402       402       402    402.00        2412        2.49


HOT Loop constructs (5 total):
Header blk IA  arch inst static dynamic iter inst/iter nodes taken !taken  BL  BLR
0000000400eb40     112        6    2412  450       5.4     1  0.00   0.00   0    0
                 BkEdge: bc_tk bc_nt fallth     Edge:  bc_tk  bc_nt   br fallth
                           402     0      0                0     0     0      0


HOT long latency instruction blocks:
  0x00000400ea7c-0x00000400ea90 N:48 6 inst badness 240


HOT redundant loads:
 intra+stack: 261 (0.27%) inter+stk: 552 (0.57%) intra: 0 (0.00%) inter: 0 (0.00%)
  0x00000400e0d4-0x00000400e0f4 N:200 redundant loads 487


HOT bad branch hints:
0x000004025dc4 hint likely not taken but was taken 36.47% (450/1234)


branch mispredict summary
  16444 branches 1271 mispredict 1240 penalty samples avg penalty 24.7cy total penalty 30618cy


HOT branch mispredict count:
0x000004025dc4 mispredict 450 (36.5% of 1234) pen 17.0cy avg over 450 LBE 0.0081/0.1153


HOT branch mispredict frequency:
0x00000400e0a4 mispredicted 100.0% of 1 pen 17.0cy avg over 1
0x00000400e824 mispredicted 47.3% of 110 pen 19.8cy avg over 52


HOT branches with high linear branch entropy and executed frequently
  0x00000400e824 N:110      LBE 0.6909/0.0000
  0x00000400e2b4 N:240      LBE 0.4333/0.0455


HOT load hit store separated by less than 100 instructions:
                      of all exec:  Pathlength     Std. red other   AGEN
ST IA   LD IA  Count   %  count min count  Avg max Dev. LDs store regs Store Values
400df64 400e0dc  200 100.0  200  13    87 34.2  68 358   87 2/2/2 st: G1 ld: G1
Total LHS events: 3282 15.1% of loads 20.0% of stores
The information displayed may be a bit cryptic, but there is comprehensive documentation that comes with pipestat. The pipestat tool can be found at https://developer.ibm.com/tutorials/download-and-install-sdk-for-lop/.
pveclib
![]()
No Instruction Set Architecture (ISA) can have every possible useful vector instruction and an associated compiler built-in. The pveclib project provides some well-crafted implementations of useful vector functions which are not part of the Power ISA. A sampling of the functions includes:
udiv_qrnndfxu_bcdadd, fxu_bcd_subvec_BCD2DFP, vec_DFP2BCDvec_bcdadd, vec_bcdsub, vec_bcdmul, vec_bcddivvec_shift_leftdovec_isalpha, vec_isalnum, vec_isdigitvec_toupper, vec_tolowervec_absdubvec_revq, vec_revd, vec_revw, vec_revhvec_clzq, vec_popcntqvec_sldq, vec_srqi, vec_srq, vec_slqi, vec_slqvec_pastedvec_mulouw, vec_muleuw, vec_mulosw, vec_muleswvec_adduqm, …- …
The pveclib project is open source and can be found at https://github.com/open-power-sdk/pveclib.
SPHDE
![]()
The Shared Persistent Heap Data Environment (SPHDE) provides some advanced, high-performance, cross-platform implementations of functionality useful in a multiprocess or multithreaded application environment:
- Shared Address Space (SAS): A shared-memory implementation in which the virtual addresses of data are common, so interprocess communications can freely pass pointers to data
- Shared Persistent Heap: A multiprocess environment can allocate memory dynamically in the Shared Address Space
- Lockless Logger: A multithreaded or multiprocess environment can safely and locklessly use an in-memory logging capability for recording events with minimal application performance impact
- Lockless producer-consumer queue: Message passing between multiple processes can be fast and efficient, avoiding the use of locks and requiring zero copying
- Fast timestamps: Instead of using expensive system calls or somewhat less expensive virtual dynamic shared objects (VDSOs), a single instruction can be used to access a system-wide synchronized timebase register, which is significantly faster.
SPHDE is open source and can be found at https://github.com/sphde/sphde.
LPCPU
![]()
The Linux Performance Customer Profiling Utility (LPCPU) is a free download which can be used to collect system information and system performance-related data. Use of LPCPU is a three-step process:
System-wide data is collected for a specified period of time. The information collected is gathered into a compressed .tar file.
# tar -xjf lpcpu.tar.bz2
# cd lpcpu
# ./lpcpu.sh duration=150 extra_profilers="perf tcpdump"
[…]
Packaging data...data collected is in /tmp/lpcpu_data.hostname.default.2018-02-26_1000.tar.bz2
The .tar file can then be offloaded to another system for post-processing and analysis.
$ tar -xf ./lpcpu_data.hostname.default.2018-02-26_1000.tar.bz2
$ cd ./lpcpu_data.hostname.default.2018-02-26_1000
$ ./postprocess.sh
Point a browser at the resulting summary.html file.
Data collected includes output from the following common tools:
iostatmpstatvmstatperfor OProfilememinfotopsar/proc/interruptstcpdump- Kernel trace
- Hardware performance counters
netstat...
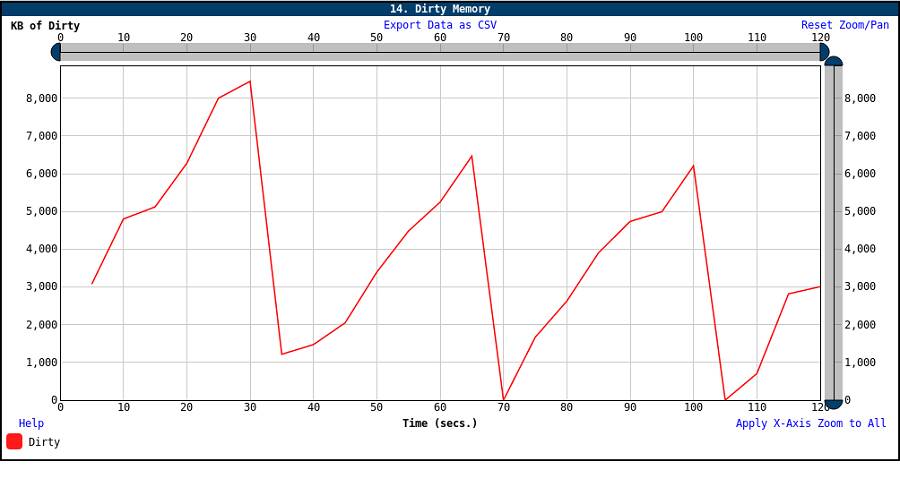
The post-processing steps create numerous charts and interactive graphs.
Figure 11. LPCPU CPU utilization graph 1
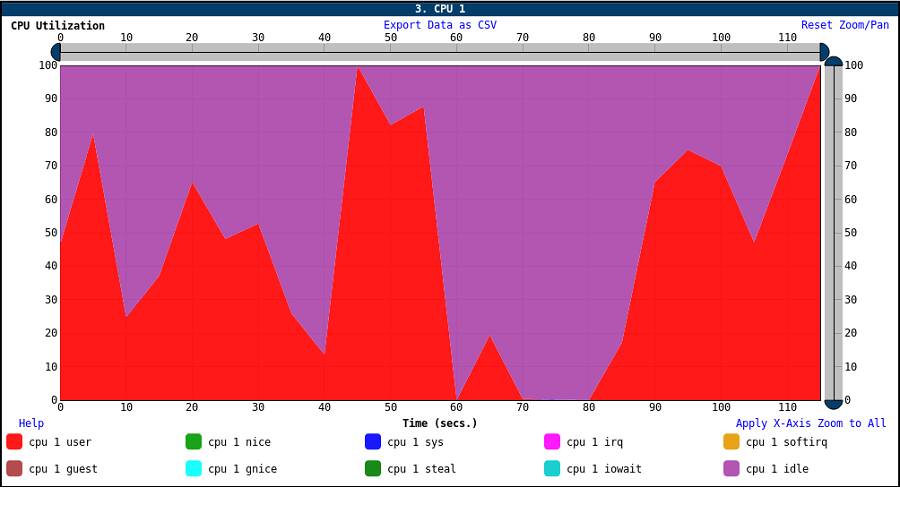
Figure 12. LPCPU CPU utilization graph 2
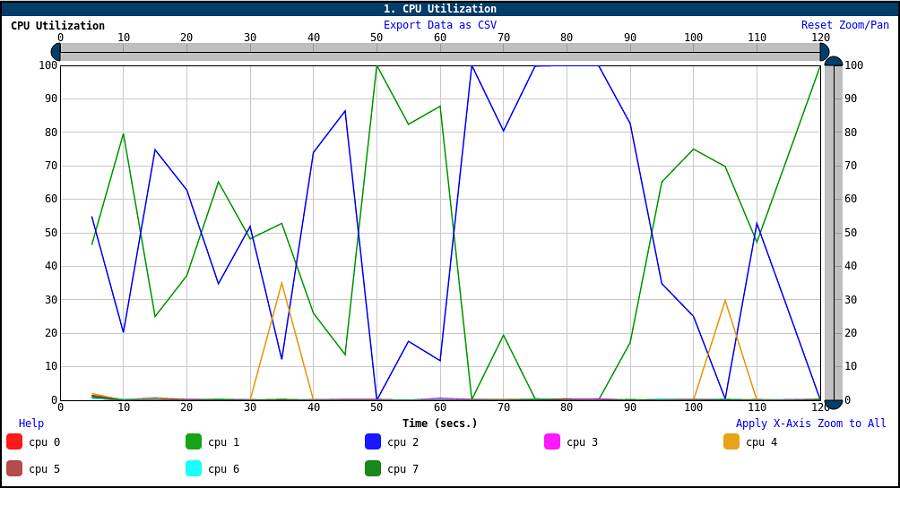
Figure 13. LPCPU Interrupts graph
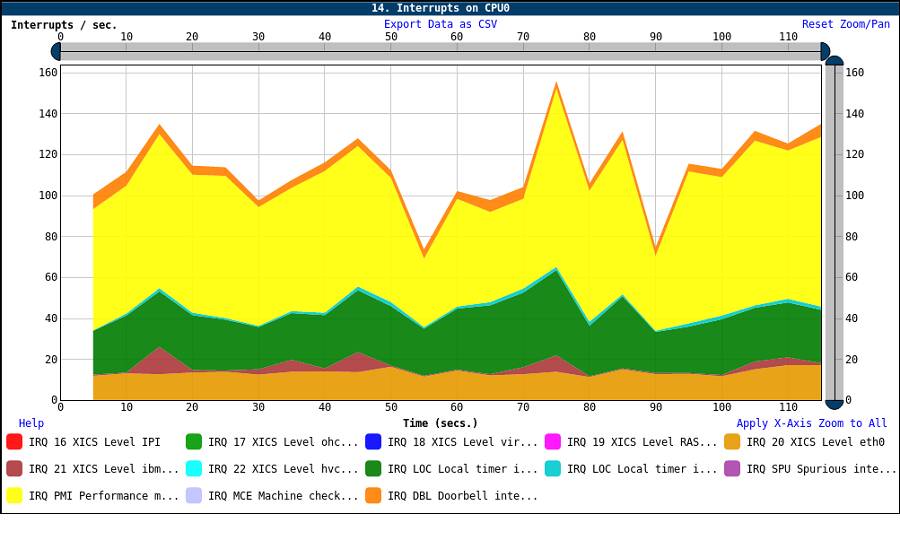
Figure 14. LPCPU Dirty Memory graph
The LPCPU tool is open source and can be freely downloaded at https://github.com/open-power-sdk/lpcpu.
Support
Formal support is available for the Advance Toolchain and the XL compilers.
The IBM Power Developer eXchange Community is a hub for all sorts of information about hardware and software components in the Linux on Power ecosystem. Refer to: https://community.ibm.com/community/user/powerdeveloper/home.
Community support options are also available at the following well-known websites:
- https://stackoverflow.com
- https://serverfault.com
- https://stackexchange.com
- And other similar websites
Best practices
Given all the nifty tools mentioned, where should one start when embarking on an effort to port code to Linux on Power?
For interpreted code, including Java, Python, Perl, and shell scripts, just move the code to Linux on Power, and it should run without modification.
For compiled code, with little to no source code analysis:
- Start with ma (Migration Advisor). It will flag portability issues in the code being ported.
- Build with the Advance Toolchain. Measure performance.
Build with XL compilers, using the Advance Toolchain libraries. Measure performance.
Additionally, for compiled code:
Use common performance analysis tools such as perf to look for hot spots in the code for careful analysis, and see if any can be explained by architectural differences between prior platforms and Power. See "Porting to Linux on Power: 5 tips that could turn a good port into a great port" at https://developer.ibm.com/articles/l-port-x86-lop/. Apply mitigation if possible.
Consider using the cpi-breakdown tool for deeper architecture-specific analysis. Drill-down on higher-frequency hazards. Apply mitigation if possible.
For very deep analysis, consider using the pipestat command for fine-grained instruction-level analysis.
As always, consider alternative approaches to common, important functionality that might be provided by SPHDE or pveclib.
For system-wide performance analysis, use LPCPU and/or curt.
Learn more
- Porting to Linux on Power: 5 tips that could turn a good port into a great port
- IBM Software Development Kit for Linux on Power (SDK)
- GitHub - open-power-sdk/power-simulator
- Port your x86 Linux applications to Linux on IBM Power
- IBM Redbook - Performance Optimization and Tuning Techniques for IBM Power Systems Processors Including IBM Power8
- IBM Redbook - Implementing an IBM High-Performance Computing Solution on IBM Power8
- OpenPOWER Foundation
Conclusion
Hopefully, the collection of tools explained in this article provide what's needed to get the best results as quickly as possible. If there is a gap in a tool's functionality or documentation, or a new tool would help, or reality isn't meeting expectations, ask in one of the support channels! We're here to help!
Take the next step
Join the Power Developer eXchange Community (PDeX). PDeX is a place for anyone interested in developing open source apps on IBM Power. Whether you're new to Power or a seasoned expert, we invite you to join and begin exchanging ideas, sharing experiences, and collaborating with other members today!