Tutorial
Monitor Spring Boot microservices
Build comprehensive monitoring capabilities for Spring Boot microservices using Micrometer, Prometheus, and GrafanaObservability, which is comprised of monitoring, logging, tracing, and alerting aspects, is an important architectural concern when using microservices and event-driven architecture (EDA) styles, primarily because:
- A large number of deployments require automation and centralization of monitoring/observability
- The asynchronous and distributed nature of the architecture results in difficulties related to correlating metrics produced from multiple components
Addressing this architectural concern provides simplified management and quick turn-around time for resolving runtime issues. It also provides insights that can help in making informed architectural, design, deployment, and infrastructure decisions to improve non-functional characteristics of the platform. Additionally, useful business/operations insights can be obtained by engineering emission, collection ,and visualization of custom metrics.
However, it is often a neglected architectural concern. This tutorial describes guidelines and best practices for the monitoring aspect of observability for Java and Spring Boot microservices using open source tools such as Micrometer, Prometheus, and Grafana.
Prerequisites
Before you begin this tutorial, you need to set up the following environment:
- A Docker environment with Docker Compose
- A Java IDE for cloning and editing the code in the git repo
Estimated time
It should take you about 2 hours to complete this tutorial.
Brief overview of monitoring
The main objectives for a monitoring tool are:
- Monitor the application's performance
- Provide self-service to stakeholders (development team, infrastructure team, operational users, maintenance teams, and business users)
- Assist in performing quick root cause analysis (RCA)
- Establish the application's performance baseline
- If using cloud, provide the ability to monitor cloud usage costs, and monitor different cloud services in an integrated way
Monitoring is mainly comprised of the following four sets of activities:
Instrumentation of the application(s) - Instrumenting the application to emit the metrics that are of importance to the application monitoring and maintenance teams, as well as for the business users. There are many non-intrusive ways for emitting metrics, the most popular ones being "byte-code instrumentation," "aspect-oriented programming," and "JMX."
Metrics collection - Collecting metrics from the applications and persisting them in a repository/data-store. The repository then provides a way to query and aggregate data for visualization. Some of the popular collectors are Prometheus, StatsD, and DataDaog. Most of the metrics collection tools are time-series repositories and provide advanced querying capability.
Metrics visualization - Visualization tools query the metrics repository to build views and dashboards for end-user consumption. They provide rich user interface to perform various kinds of operations on the metrics, such as aggregation, drill-down, and so on.
Alerts and notifications - When metrics breach defined thresholds (for instance CPU is more than 80% for more than 10 minutes), human intervention might be required. For that, alerting and notifications are important. Most visualization tools provide alerting and notification ability.
There are many open source and commercial products available for monitoring. Some of the notable commercial products are: AppDynamics, Dynatrace, DataDog, logdna, and sysdig. Open-source tools are typically used in combination. Some of the very popular combinations are Prometheus and Grafana, Elastic-Logstash-Kibana (ELK), and StatsD + Graphite.
Monitoring guidance for microservices
It is encouraged to have uniformity in types of metrics being collected across all microservices. This helps in increasing the reusability of dashboards, and simplifies aggregation and drill-down of metrics to visualize them at different levels.
What to monitor
Microservices will expose an API and/or consume events and messages. During processing, it might invoke its own business components, connect to a database, invoke technical services (caching, auditing, etc), invoke other microservices, and/or publish events and messages. It is beneficial to monitor metrics at these different stages of processing because it helps to provide detailed insights on performance and exceptions. This in turn helps in quick analysis of issues.
Commonly collected metrics relevant to event-driven architrecture (EDA) and microservices include:
Resource utilization metrics
- Resource utilization - CPU, memory, disk utilization, network utilization, etc
- JVM heap and GC metrics - GC overhead, GC time, heap (and its distinct regions) utilization
- JVM thread utilization - blocked, runnable, waiting connection use time
Application metrics
Availability, latency, throughput, status, exceptions, and more for different architectural layers of the microservice, such as:
- Controller layer - for HTTP/REST Method calls including
- Service layer - for method invocations
- Data access layer - for method invocations
- Integration layer - for RPC invocations, HTTP/REST/API calls, messaging publishing, message consumption
Technical services utilization metrics (specific to the technical service)
- Caches - cache hits, misses, puts, deletes, reads
- Loggers - number of log events per log level
- Connection pools - connections in use, connection wait time, connection create time, idle connections
Middleware metrics
- Event broker metrics - availability, messages in/out, bytes in/out, consumption lag, (de)-serialization exceptions, cluster status
- Database metrics
For application metrics, ideally the entry and exit point in each architectural layer of the microservice should be instrumented.
Critical metrics characteristics for microservices
The following three characteristics of metrics are important when monitoring microservices:
- Dimensionality
- Time series/Rate aggregation
- Metrics viewpoints
Dimensionality
Dimensions control how a metric is aggregated as well as the extent of drill-down of a particular metric. It is realized by adding tags to a metric. Tags is a name=value pair of information. Tags are used to qualify fetching or aggregation of metrics through queries to the monitoring system. It is an important characteristic for monitoring microservices due to large number of deployments. In other words, in an eco-system of microservices, multiple microservices (or even different components of a microservice) would emit metrics with same names. To distinguish between them, you qualify the metrics with dimensions.
For instance, consider the metric http_server_requests_seconds_count. If there are more than one API endpoints (which is the case in an eco-system of microservices), then without dimensions, one can only view the aggregated values of this metric at the platform level. It won't be possible to get a distribution across different API endpoints. Adding a uri tag to the metric while emitting it would enable fetching this distribution. Take a look at the following example, which explains this characteristic.
If http_server_requests_seconds_count is emitted with the following tags:
http_server_requests_seconds_count{appName="samplemicrosvc",env="local",exception="None",instanceId="1",method="GET",outcome="SUCCESS",status="200",uri="/addressDetails/{addressId}",} 67.0
http_server_requests_seconds_count{appName="samplemicrosvc",env="local",exception="InternalServerError",instanceId="1",method="GET",outcome="SERVER_ERROR",status="500",uri="/userInfo/{userId}",} 39.0
http_server_requests_seconds_count{appName="samplemicrosvc",env="local",exception="None",instanceId="1",method="GET",outcome="SUCCESS",status="200",uri="/userInfo/{userId}",} 67.0
http_server_requests_seconds_count{appName="samplemicrosvc",env="local",exception="IllegalArgumentException",instanceId="1",method="GET",outcome="SERVER_ERROR",status="500",uri="/addressDetails/{addressId}",} 13.0
http_server_requests_seconds_count{appName="samplemicrosvc",env="local",exception="IllegalStateException",instanceId="1",method="GET",outcome="SERVER_ERROR",status="500",uri="/addressDetails/{addressId}",} 26.0
Then the http_server_requests_seconds_count can be aggregated at the appName level, at the instanceId level, by HTTP response status, or by outcome, as demonstrated by the following queries:
# Count distribution by status for a given environment
sum by (status) (http_server_requests_seconds_count{env="$env"})

# Count distribution by uri and status for a given environment
sum by (uri, status) (http_server_requests_seconds_count{env="$env"})

# Count distribution by uri, status and appName for a given environment
sum by (uri, status, appName) (http_server_requests_seconds_count{env="$env"})
Tags can also be used as query criteria. Note the usage of the env tag, where $env is a Grafana dashboard's variable for user input "environment."
Time series/Rate aggregation
The ability to aggregate metrics over time is important for identifying patterns in the application's performance, such as correlating performance with load patterns, building performance profile for a day/week/month, and creating application's performance baseline.
Metrics viewpoints
This is a derived characteristic and provides the ability to group metrics together for ease of visualization and use. For instance:
- A dashboard that depicts the availability status of all microservices of the platform
- A drill-down (detailed) view per microservice to view the detailed metrics of a microservice
- A view cluster level and detailed view of metrics of middleware components, such as Event Broker
Instrumenting a Spring Boot microservice
This section covers instrumentation of a microservice and its rest controllers, service beans, component beans, and data access objects. This section also covers instrumentation of kafka-consumer, kafka-producer, and camel routes, which are relevant if kafka, spring-cloud-stream, or Apache Camel are used for integration or EDA.
To help with the monitoring and management of a microservice, enable the Spring Boot Actuator by adding spring-boot-starter-actuator as a dependency. Multiple HTTP and JMX endpoints to monitor the application are available out of the box, including basic monitoring of a microservice's health, beans, application information, and environment information.
Dependency addition is as follows:
<dependency>
    <groupId>org.springframework.boot</groupId>
    <artifactId>spring-boot-starter-actuator</artifactId>
</dependency>
Metrics available out of the box with Actuator
Once the Spring Boot Actuator is added to the microservice, the following metrics are enabled out of the box:
- JVM metrics (related to GC and thread utilization)
- Resource utilization metrics (CPU, threads, file descriptors, JVM heap, and garbage collection metrics)
- Kafka consumer metrics
- Logger metrics (Log4j2, Logback)
- Availability metrics (process up-time)
- Cache metrics (out of the box for Caffeine, EhCache2, Hazelcast, or any JSR-107-compliant cache)
- Tomcat metrics
- Spring integration metrics
Metrics endpoint
Actuator also creates an endpoint for metrics. By default, it is /actuator/metrics. It needs to be exposed through Spring configuration. The following is a sample configuration:
management:
  endpoints:
    web:
      exposure:
        include: ["health", "info", "metrics", "prometheus", "bindings", "beans", "env", "loggers", "streamsbindings"]
Micrometer
To integrate with Metrics Tool, Spring Boot Actuator provides auto-configuration for Micrometer. Micrometer provides a facade for a plethora of monitoring systems, including Prometheus. This tutorial assumes some level of familiarity with Micrometer concepts. Micrometer provides three mechanisms to collect metrics:
- Counter - typically used to count occurrences, method executions, exceptions, and so on
- Timer - used for measuring time duration and also occurrences; typically used for measuring latencies
- Gauge - single point in time metric; for instance, number of threads
Integration with Prometheus
Since Prometheus uses polls to collect metrics, it is relatively simple two-step process to integrate Prometheus and Micrometer.
Add the
micrometer-registry-prometheusregistry.Declare a bean of type
MeterRegistryCustomizer<PrometheusMeterRegistry>.This is an optional step. However, it is recommended, as it provides a mechanism to customize the
MeterRegistry. This is useful for declaring common tags (dimensions) for the metrics data that would be collected by Micrometer. This helps in metrics drill-down. It is especially useful when there are a lot of microservices and/or multiple instances of each microservice. Typical common tags could beapplicationName,instanceName, andenvironment. This would allow you to build aggregated visualizations across instances and applications as well as be able to drill down to a particular instance/application/environment.
Once configured, Actuator will expose an endpoint /actuator/prometheus, which should be enabled in Spring configuration. A job needs to be added in Prometheus through its configuration to scrape this endpoint at the specified frequency.
Add Prometheus dependency to pom
<dependency>
    <groupId>io.micrometer</groupId>
    <artifactId>micrometer-registry-prometheus</artifactId>
</dependency>
Customize the MetricsRegistry
The configuration class that declares the MetricsRegistryCustomizer can be written as part of framework so that all MicroServices implementation can reuse it. Tag values can be supplied using system/application properties.
@Configuration
public class MicroSvcMeterRegistryConfig {
    @Value("${spring.application.name}")
    String appName;

    @Value("${env}")
    String environment;

    @Value("${instanceId}")
    String instanceId;

    @Bean
    MeterRegistryCustomizer<PrometheusMeterRegistry> configureMetricsRegistry()
    {
        return registry -> registry.config().commonTags("appName", appName, "env", environment, "instanceId", instanceId);
    }
Instrumentation of application-level metrics
Some application-level metrics are available out of the box and, for some, a variety of techniques can be employed. This following chart summarizes these features:
| Metrics | Controllers | Service layer components | Data access objects | Business components | Technical components | Kafka Consumers | Kafka Producers | Spring integration components | HTTP Client | Camel routes |
|---|---|---|---|---|---|---|---|---|---|---|
| Resource utilization (CPU, threads, file descriptors, heap, GC) | Out of the box at microservice instance level | |||||||||
| Availability | Out of the box at microservice instance level | |||||||||
| Latency | Out of the box with @Timed annotation |
Done through custom reusable aspects of Spring-AOP | Done through custom reusable aspects of Spring-AOP | Done through custom reusable aspects of Spring-AOP | Out of the box for logging, caching, and JDBC connection pools | Out of the box if spring-cloud-stream is used | Done through custom MeterBinder beans | Out of the box | Out of the box | Partial support available. Custom instrumentation of routes required. |
| Throughput | Out of the box with @Timed annotation |
Done through custom reusable aspects of Spring-AOP | Done through custom reusable aspects of Spring-AOP | Done through custom reusable aspects of Spring-AOP | Out of the box for logging, caching, and JDBC connection pools | Out of the box if spring-cloud-stream is used | Done through custom MeterBinder beans | Out of the box | Out of the box | Partial support available. Custom instrumentation of routes required. |
| Exceptions | Out of the box with @Timed annotation |
Done through custom reusable aspects of Spring-AOP | Done through custom reusable aspects of Spring-AOP | Done through custom reusable aspects of Spring-AOP | Out of the box for logging, caching, and JDBC connection pools | Out of the box if spring-cloud-stream is used | Done through custom MeterBinder beans | Out of the box | Out of the box | Partial support available. Custom instrumentation of routes required. |
Instrumenting REST Controllers
The quickest and easiest way to instrument REST controllers is to use the @Timed annotation on the controller or on individual methods of the controller. @Timed automatically adds these tags to the timer: exception, method, outcome, status, uri. It is also possible to supply additional tags to the @Timed annotation.
Instrumenting different architectural layers of a microservice
A microservice would typically have Controller, Service, DAO, and Integration layers. Controllers don't require any additional instrumentation when @Timed annotation is applied to them. For Service, DAO, and Integration layers, developers create custom beans annotated with @Service or @Component annotations. Metrics related to latency, throughput, and exceptions can provide vital insights. These can be easily gathered using Micrometer's Timer and Counter metrics. However, the code needs to be instrumented for applying these metrics. A common reusable class that instruments services and components can be created using spring-aop, which would be reusable across all microservices. Using @Around and @AfterThrowing advice metrics can be generated without adding any code to the service/component classes and methods. Consider the following guidelines about developing such an aspect:
Create reusable annotations to apply to different types of Components/Services. For example, custom annotations, such as
@MonitoredService,@MonitoredDAO, and@MonitoredIntegrationComponent, can be applied to services, data access objects, and integration components, respectively.Define multiple pointcuts to apply advice for different types of components and which have above-mentioned annotations on them.
Apply appropriate tags to the metric so that drill-down or slicing of metrics is possible. For instance, tags such as
componentClass,componentType,methodName, andexceptionClasscan be used. With these tags and common-tags, the metric would be emitted as follows:component_invocation_timer_count{env="local", instanceId="1", appName="samplemicrosvc", componentClass="SampleService", componentType="service", methodName="getUserInformation"} 26.0
Take a look at the following sample annotation:
@Target({ElementType.TYPE})
@Retention(RetentionPolicy.RUNTIME)
public @interface MonitoredService {
}
The following code shows a sample reusable aspect that can instrument the Service classes:
@Configuration
@EnableAspectJAutoProxy
@Aspect
public class MonitoringAOPConfig {

    @Autowired
    MeterRegistry registry;

    @Pointcut("@target(com.ibm.dip.microsvcengineering.framework.monitoring.MonitoredService) && within(com.ibm.dip..*)")
    public void servicePointcut() {
    }

    @Around("servicePointcut()")
    public Object serviceResponseTimeAdvice(ProceedingJoinPoint pjp) throws Throwable {
        return monitorResponseTime(pjp, TAG_VALUE_SERVICE_TYPE);
    }

    @AfterThrowing(pointcut = "servicePointcut()", throwing = "ex")
    public void serviceExceptionMonitoringAdvice(JoinPoint joinPoint, Exception ex)
    {
        monitorException(joinPoint, ex, TAG_VALUE_SERVICE_TYPE);
    }

    private Object monitorResponseTime(ProceedingJoinPoint pjp, String type) throws Throwable {
        long start = System.currentTimeMillis();
        Object obj = pjp.proceed();
        pjp.getStaticPart();
        long end = System.currentTimeMillis();
        String serviceClass = getClassName(pjp.getThis().getClass().getName());
        String methodName = pjp.getSignature().getName();

        Timer timer = registry.timer(METER_COMPONENT_TIMER,
                TAG_COMPONENTCLASS, serviceClass, TAG_METHODNAME, methodName, TAG_OUTCOME, SUCCESS, TAG_TYPE, type);
        timer.record((end - start), TimeUnit.MILLISECONDS);

        Counter successCounter = registry.counter(METER_COMPONENT_COUNTER,
                TAG_COMPONENTCLASS, serviceClass, TAG_METHODNAME, methodName, TAG_OUTCOME, SUCCESS, TAG_TYPE, type);
        successCounter.increment();
        return obj;
    }

    private void monitorException(JoinPoint joinPoint, Exception ex, String type)
    {
        String serviceClass = getClassName(joinPoint.getThis().getClass().getName());
        String methodName = joinPoint.getSignature().getName();
        Counter failureCounter = registry.counter(METER_COMPONENT_EXCEPTION_COUNTER, TAG_EXCEPTIONCLASS,
                ex.getClass().getName(), TAG_COMPONENTCLASS, serviceClass, TAG_METHODNAME, methodName, TAG_OUTCOME, ERROR,
                TAG_TYPE, type);
        failureCounter.increment();
    }
}
This would abstract out all the instrumentation logic from microservices into a set of reusable aspects and annotations. The microservices developer just has to apply the respective annotations on his or her classes.
A sample instrumented Service class will have the following annotations on it. Automatically, all the methods in this Service class will become candidates for applying the serviceResponseTimeAdvice and serviceExceptionMonitoringAdvice.
@Service
@MonitoredService
public class SampleService {
   ...
}
Instrumenting outbound HTTP/REST calls
Instrumentation of outbound HTTP/REST calls is provided out of the box by spring-actuator. However, for this to work, RestTemplate should be obtained from a bean RestTemplateBuilder. Additionally, custom tags can be added to the metrics if a custom bean of type RestTemplateExchangeTagsProvider is provided.
The following configuration class illustrates this:
    @Bean
    public RestTemplate restTemplate(RestTemplateBuilder templateBuilder)
    {
        templateBuilder = templateBuilder.messageConverters(new MappingJackson2HttpMessageConverter())
                .requestFactory(this::getClientHttpRequestFactory);
        return templateBuilder.build();
    }

    @Bean
    public RestTemplateExchangeTagsProvider restTemplateExchangeTagsProvider()
    {
        return new RestTemplateExchangeTagsProvider() {
            @Override
            public Iterable<Tag> getTags(String urlTemplate, HttpRequest request, ClientHttpResponse response) {
                Tag uriTag = (StringUtils.hasText(urlTemplate) ? RestTemplateExchangeTags.uri(urlTemplate)
                        : RestTemplateExchangeTags.uri(request));
                return Arrays.asList(RestTemplateExchangeTags.method(request), uriTag,
                        RestTemplateExchangeTags.status(response), RestTemplateExchangeTags.clientName(request),
                        Tag.of("componentClass", "httpClient"),
                        Tag.of("componentType", "integration"),
                        Tag.of("methodName", uriTag.getValue()));
            }
        };
    }
Instrumenting Kafka Consumers
Kafka Consumers are instrumented by default by Actuator. More than 30 metrics related to Kafka Consumers are collected by Actuator and Micrometer. The common tags are also applied on the Kafka Consumers. Some of the notable metrics are kafka_consumer_records_consumed_total_records_total, kafka_consumer_bytes_consumed_total_bytes_total, and kafka_consumer_records_lag_avg_records. Then, using dimensions, one can group them by Kafka-Topics, Kafka-partitions, and more.
Instrumenting Kafka Producers
Kafka Producers are NOT instrumented by Actuator by default. Kafka Producer has its own implementation of Metrics. To register these metrics with Micrometer, define a bean of type MeterBinder for each KafkaProducer<?,?>. This MeterBinder will create and register Gauges with Micrometer Registry. With this approach, more than 50 Kafka Producer metrics can be collected. The common tags and additional tags (during building the gauges) would provide multiple dimensions to these metrics.
The following code shows what a typical implementation of MeterBinder would look like:
public class KafkaProducerMonitor implements MeterBinder {

    //Filter out metrics that don't produce a double
    private Set<String> filterOutMetrics;
    //Need to store the reference of the metric - else it might get garbage collected. KafkaMetric is a custom implementation that holds reference to the MetricName and KafkaProducer
    private Set<KafkaMetric> bindedMetrics;
    private KafkaProducer<?,?> kafkaProducer;
    private Iterable<Tag> tags;

    public KafkaProducerMonitor(KafkaProducer kafkaProducer, MeterRegistry registry, Iterable<Tag> tags)
    {
       ...
    }

    @Override
    public void bindTo(MeterRegistry registry) {
        Map<MetricName, ? extends Metric> metrics = kafkaProducer.metrics();
        if (MapUtils.isNotEmpty(metrics))
        {
            metrics.keySet().stream().filter(metricName -> !filterOutMetrics.contains(metricName.name()))
                    .forEach(metricName -> {
                        logger.debug("Registering Kafka Producer Metric: {}", metricName);
                        KafkaMetric metric = new KafkaMetric(metricName, kafkaProducer);
                        bindedMetrics.add(metric);
                        Gauge.builder("kafka-producer-" + metricName.name(), metric, KafkaMetric::getMetricValue)
                                .tags(tags)
                                .register(registry);
                    });
        }
    }
}
Note: There are other third-party components that emit metrics but are not integrated with Micrometer. In such cases, the pattern mentioned above can be leveraged; one example being Apache Ignite.
Camel integration
If Apache Camel is being used for integration, there would be integration and processing Routes in the application. It makes sense to have metrics at Route level as well. Camel provides endpoints for Micrometer through its camel-micrometer component. Adding the camel-micrometer dependency in the application's pom enables Micrometer endpoints to start/stop timers and increment counters. These can be used to collect route-level metrics. Other Camel-specific beans, such as those of type org.apache.camel.Processor, can be instrumented using the AOP approach previously described.
To enable micrometer endpoints, add camel-micrometer dependency as follows:
<dependency>
    <groupId>org.apache.camel</groupId>
    <artifactId>camel-micrometer</artifactId>
</dependency>
To publish metrics for a route, RouteBuilder should send messages to Micrometer, as shown in the following code:
@Override
public void configure() throws Exception {
     from(inputEndpoints).
       routeId(routeId).
       to("micrometer:timer:route_timer" + "?" + "action=start" + "&" + "routeName=<routeId>").
       to("micrometer:counter:route_counter" + "?" + "routeName=<routeId>")
       ... //other route components
       ... //and finally
       to("micrometer:timer:route_timer" + "?" + "action=stop" + "&" + "routeName=<routeId>");

}
Instrumentation summary
As you can see, a large number of metrics can be collected and pushed to Prometheus using:
- Out-of-the-box metrics provided by Actuator.
- Custom metrics through instrumenting the code using AOP and
MeterBinder. All of this custom instrumentation code is reusable and can be built as a library, which is consumed by all microservices implementations.
Both methods provide a consistent and minimally intrusive way of collecting metrics across multiple microservices and their multiple instances.
Prometheus integration with other third-party systems
Prometheus has a healthy development ecosystem. There are multiple libraries and servers that are available for exporting metrics of third-party systems to Prometheus, which are catalogued at Prometheus Exporters. For instance, the mongodb_exporter can be used to export MongoDB metrics into Prometheus.
Apache Kafka makes its metrics available with JMX. They can be exported into Prometheus as described in the following sections.
Integrating Kafka with Prometheus
If you are using Kafka as your message/event broker, then integration of Kafka metrics with Prometheus is not out of the box. A jmx_exporter needs to be used. This needs to be configured on the Kafka Brokers, and then the brokers will start exposing metrics over HTTP. jmx_exporter requires a configuration file (.yml). A sample configuration is provided in the examples folder of the jmx_exporter repository.
For this tutorial, we build a custom Kafka image only for the purpose of demonstration. Instructions for building a custom Kafka image with jmx_exporter are provided in the code repository's README.md
Building Dashboards in Grafana
Once the metrics are registered with Prometheus Meter Registry and Prometheus is up and running, it will start collecting the metrics. These metrics can now be used to build different monitoring dashboards in Grafana. Multiple dashboards are required for different viewpoints. It is a good practice to have these dashboards:
Platform overview dashboard, which provides availability status of each microservice and other software components of the platform (for example, Kafka). This type of dashboard can also report aggregated metrics at the platform level for
request-rates(HTTP request rates, Kafka consumption request rates, and more), andexception counts.Microservices drill-down dashboard, provides detailed metrics of an instance of a microservice. It is important to declare
variablesin Grafana, which correspond to different tags used in the metrics. For example,appName,env,instanceId, and more.Middleware monitoring dashboard, which provides a detailed drill-down view of the middleware components. These are specific to the middleware (for example, Kafka dashboard). Here, also, it is important to declare
variablesso that metrics can be observed atclusterlevel as well as atinstancelevel.
Using dimensionality for drill-down and aggregation
While reporting metrics, tags are added to the metrics. These tags can be used in Prometheus queries to aggregate or drill down on the metrics. For instance, at the platform overview level, one would like to view the total number of exceptions in the platform. This can be easily done using the following query:
sum(component_invocation_exception_counter_total{env="$env"})
This will show the count as:
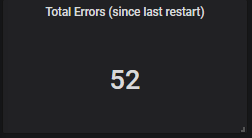
Now to drill down the same metric at method- and exception-type level, the Prometheus query would be as follows:
sum by(appName, instanceId, componentClass, methodName, exceptionClass)(component_invocation_exception_counter_total{env="$env", appName="$application", instance="$instance"})
It would produce the details as:
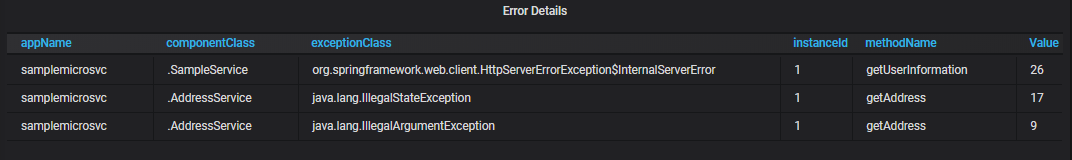
Note the $ variables. These are defined as variables in the dashboard. Grafana will populate them based on different metrics available in Prometheus. The user of the dashboard can choose their respective values, and that can be used to dynamically change the metric visualization without creating new visualizations in Grafana.
As an another example, consider the below prometheus query for visualizing the throughput of service beans in a particular microservice instance.
rate(component_invocation_timer_seconds_count{instance="$instance", appName="$application", componentType="service"}[1m])",
Sample platform overview dashboard
The following dashboard visualizes metrics at platform level:
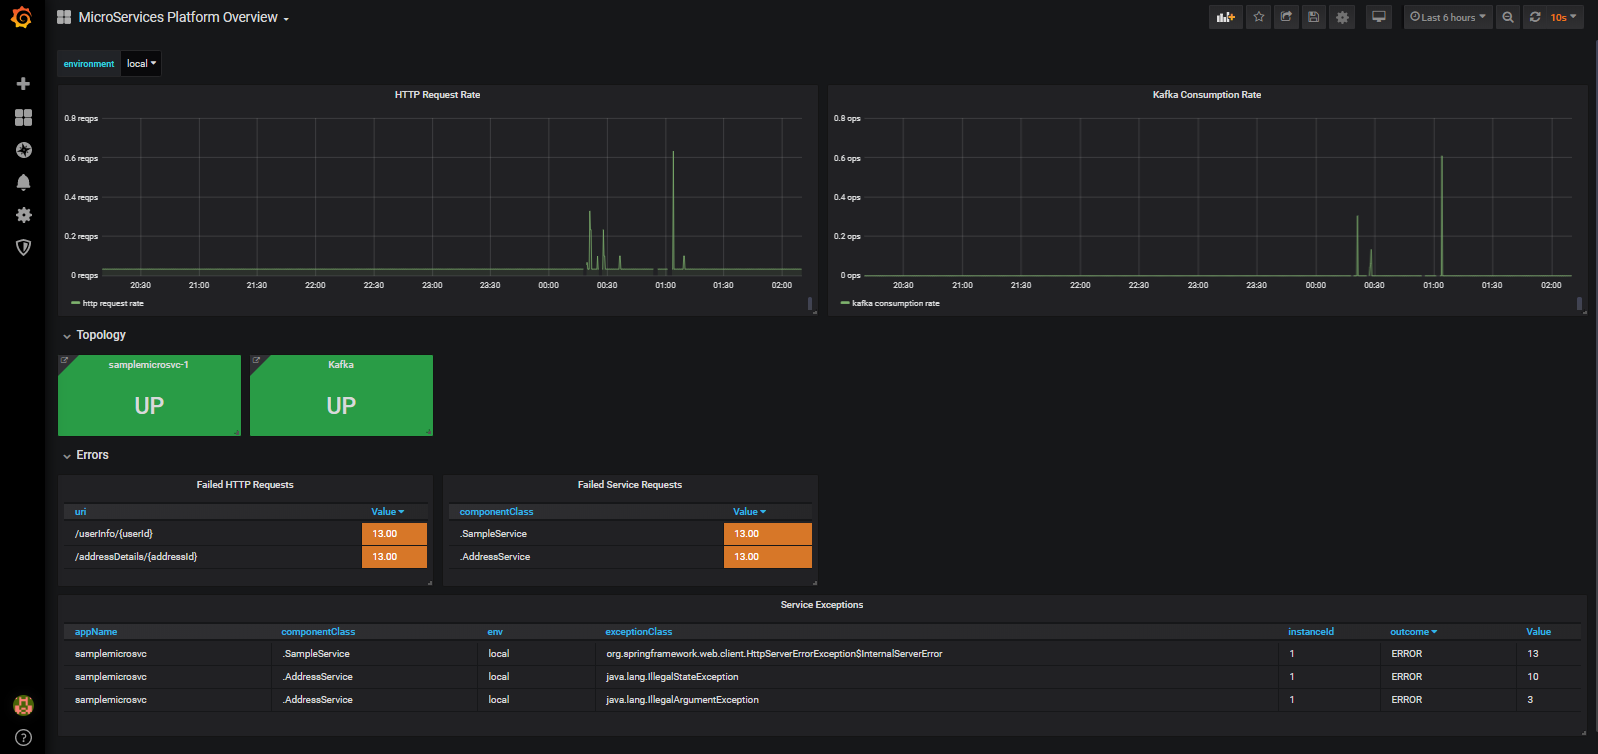
It provides:
HTTP Request Rate and Kafka Consumption Rate for all REST Controller methods and Kafka Consumers
Availability status of all microservices instances and Kafka cluster.
Note that each visualization in this is a hyperlink for a particular microservice instance, which provides navigation to the detailed drill-down dashboard of that microservice instance.
Failed HTTP Requests and Service Errors for all microservices instances.
A breakdown of exceptions for all microservices instances.
Sample microservices drill-down dashboard
This dashboard is organized into multiple sections, called "rows" in Grafana. This dashboard provides all the metrics of a particular instance of a microservice. Note that it is a single dashboard having user inputs for environment, microservice, instanceId, and so on. By changing the values in these user inputs, one can view metrics for any microservice of the platform.
Note: There are multiple screenshots, since there are many metrics that have been visualized for demonstration.
Different metrics sections

Microservice instance level metrics

HTTP controller metrics

Service metrics

HTTP client metrics

Kafka Producer metrics

JDBC connection pool metrics

Sample Kafka monitoring dashboard
Kafka broker metrics

Kafka messaging statistics

Conclusion
Monitoring of Spring Boot microservices is made easy and simple with spring-boot-actuator, micrometer, and spring-aop. Combining these powerful frameworks provides a way for building comprehensive monitoring capabilities for microservices.
An important aspect of monitoring is consistency of metrics across multiple microservices and their multiple instances, which makes monitoring and trouble-shooting easy and intuitive even when there are hundreds of microservices.
Another important aspect of monitoring is different viewpoints. This can be achieved by using dimensionality and rate aggregation characteristics of metrics. Tools such as Prometheus and Grafana support this out of the box. Developers just need to ensure that the metrics being emitted have the correct set of tags on them (this in turn can be achieved easily through reusable and common aspects, and Spring configuration).
By applying this guidance, it is possible to have consistent and comprehensive monitoring for all microservices with zero to minimal intrusive glue code.
Sample code
The code examples provided in this tutorial are available in GitHub.