Article
Building AI-driven closed-loop automation systems
An introduction to closed-loop automation by using Cloud Pak for AIOps to enable a closed-loop automation system for real-world telco network workloadsToday’s cloud-native and microservices-based architectures rely on a complex infrastructure that is made up of various hardware and software components. This complexity arises because of the number of applications, the variety of hardware and software in the infrastructure, the volume of data, and the large number of business processes that are part of network and IT operations.
This increasingly complex infrastructure makes it difficult to troubleshoot and resolve issues quickly. Troubleshooting and root-cause analysis are harder with the explosion of data available from all the individual microservices. Closed-loop automation systems help transform network and IT operations by using AI-driven automation to detect anomalies, determine resolution, and implement the required changes in a highly automated framework.
Closed-loop automation systems enable companies to transform network and IT operations by using AI-driven automation to detect anomalies, determine resolution, and implement the required changes within a continuous highly automated framework. Closed-loop automation helps solve many problems before they even become issues.
One common use case for closed-loop automation is traffic flow optimization. By implementing a closed-loop automation system, teams can automatically correct issues like network anomalies within the provisioned network infrastructure. At the heart of a closed-loop automation system for the traffic flow optimization use case are the components of IBM Cloud Pak for AIOps, which is at the heart of IBM’s AIOps platform.
What is closed-loop automation?
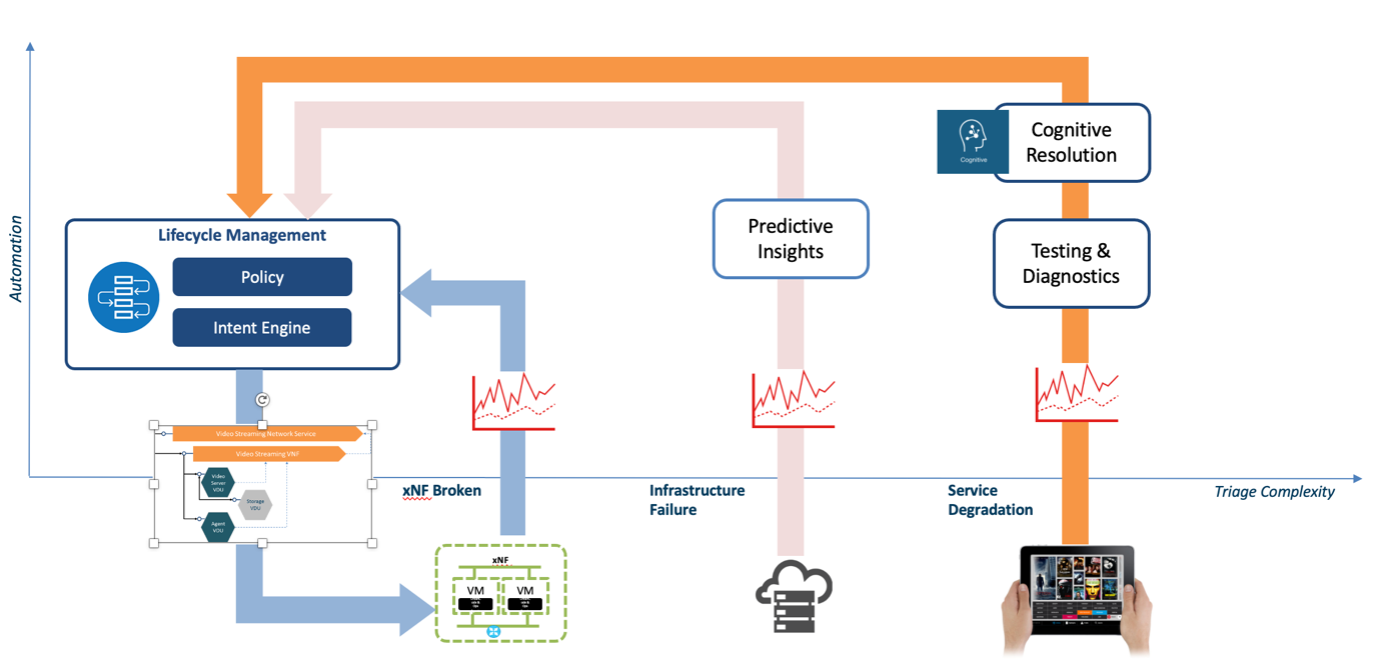
A simple closed-loop implementation detects issues that could happen in the future. The appropriate data is analyzed by various predictive models, which then make a recommendation on the change to be made to the orchestration layer, which implements the change.
In complex cases, closed-loop automation combines the predictive insights information with additional AI systems to determine a resolution. The AI system is trained to resolve these issues and is integrated with a robotics automation system (such as the impact engine in Cloud Pak for AIOps) to automate the resolution process. If the AI system determines it has a high confidence that the suggested resolution is correct, it will invoke the orchestration engine to implement the solution automatically. If not, a trouble ticket is generated, and an engineer works to resolve the issue.
The following image provides an overview of a closed-loop automation system that addresses issues of varying complexity.
Closed-loop automation enables these key capabilities:
- Anomaly detection. Anomaly detection uses large, real-time, time-series data to analyze networks applications, database metrics, operating systems, and so on. This gives anomaly detection the capability to identify patterns and anomalies, and raise awareness toward predictive actions.
- Intelligent alerts. In a general operations environment, multiple connected components can raise alerts all related to the same failure event. These add to the overall load and volume of operations teams. However, 20 percent of overall alert volume is false-positive. Closed-loop automation uses machine learning models to create the patterns for the series of alerts so that those can be bound to causes and known actions, and then be corrected accordingly.
- Predictive planning. Organizations can use machine learning algorithms to predict how application and network behaviors are dependent on seasonality and other factors to ensure that appropriate corrective actions are taken, thereby permitting systems to perform optimally.
- Root-cause analysis. Closed-loop automation leverages data to intelligently identify all anomalies in the service path and use AI to map it to find the most likely cause for a particular incident. It makes use of various AI algorithms to ensure the accuracy of root-cause identifications and implements the required remediation steps.
IT Ops teams apply AI and automation to network operations in stages:
- Simplify and focus. Use analytics and machine learning to reduce events, focus on high-value services and clients, and create real-time topology.
- Predict to get ahead. Use machine learning algorithms and analytics to digest time-series data and find patterns and seasonality of network behavior to predict abnormal behaviors that precursor events.
- Augment the process. Automate the process of operations with the application of cognitive process automation with robotics for the end-to-end operation automation and artificial intelligence to determine what is needed and next steps.
- Augment staff. Apply AI and automation to speed problem resolution and learning. Consolidate structured and unstructured data needed for the problem, provide guidance in natural language, and capture the learning for continual improvement and augmentation of operations.
Use cases for implementing closed-loop automation
Now that you have a basic understanding of closed-loop automation, let's look at some use cases:
- Container orchestration with Kubernetes
- Closed-loop automation in security
- Traffic flow optimization with closed-loop automation
Use case #1: Container orchestration with Kubernetes
Container orchestration engines, such as Kubernetes, support a few limited closed-loop automation scenarios, such as for self-healing and auto-scaling. Kubernetes internally executes a control loop where it continuously monitors for the state of deployed applications in the cluster and matches them with declarative specifications of the desired state specified by application developers. If the current state does not match the desired state, the control loop takes necessary actions to reach the desired state of the system.
Application developers can specify liveness and readiness probes as part of the deployment specification. Kubernetes will periodically invoke these probes to check if the application state is normal. If any of the probes fail for a certain pre-configured number of times, Kubernetes can restart the specific container to self-heal the application. This is a simple closed-loop automation scenario that is natively supported by Kubernetes.
Another scenario pertains to auto-scaling. Application developers can specify simple policies based on thresholds of certain metrics. If the metric crosses the specified thresholds, Kubernetes can spawn additional containers or remove surplus containers to automatically scale the service up or down. Kubernetes supports other actions as part of its control loop and is also designed to be programmatically extensible.
Use case #2: Closed-loop automation in security
As mentioned, a closed loop takes a manual process, analyzes it, and automates the process. This process can be applied in other areas of IT support. One such area is cybersecurity. Within the world of technology today, you hear about stolen data and even attacks on financial institutions fairly regularly.
We can apply closed-loop automation in this process to help enhance the security of our data. Imagine if an unknown user had tried to access our data, we can use tooling like IBM QRadar SIEM to detect the issue, find the appropriate action, and apply the changes with an orchestrator.
A closed loop automation for security goes through detecting, investigating, and then by responding to the event using the orchestrator, which is part of Cloud Pak for Network Automation.
For example, we can move the files to a location that is no longer in the reach of the attacker while simultaneously identifying how the user was able to access the data and identify and apply a way to block that vulnerability. This is just a simple idea of a closed-loop automation in cybersecurity in which we are automating the handling of the threat instead of having to wait for someone to identify, manage, and apply the security fixes.
Use case #3: Traffic flow optimization with closed-loop automation
In this use case, you can see how using operations analytics, operations/service management, cognitive operations, and MANO (Management and Orchestration) can help automatically correct issues within the provisioned infrastructures network.
When an anomaly is detected, we can divert the network traffic to a backup flow proactively, while we automatically fix the issues on the primary flow. After the issue is fixed, our AI and orchestrator can once again reroute that traffic back to the primary flow.
Benefits of closed-loop automation
Consider these benefits of closed-loop automation:
- Improved network reliability through automation built on AI. With the ability to automatically identify issues on our network, not only can we automatically fix the issue but we can also apply alternate network paths that can help mediate the effects while the fix is applied. We will expand more on this as we talk about our traffic flow optimization solution in our next article.
- Superior customer experience leading to reduced customer churn. By automatically resolving issues that may arise, we can help ensure that the end-user customer faces minimal service interruptions.
- Manual tasks are reduced through automation, increasing workforce productivity. With closed-loop automation, we are able to mitigate tasks from our network engineers who will then be able to focus on other issues that require further inspection, thus improving overall efficiency.
- Mean-time to resolution for incidents is decreased, providing improved network services, better network performance, and a faster rollout of new services.
Building a closed-loop automation system using an AIOps platform
To better understand how to set up a closed-loop automation system, let’s look at the traffic flow optimization use case. We’ll show how using AI-driven automation can help teams automatically correct issues like network anomalies within the provisioned network infrastructure by using these three main components:
IBM Cloud Pak for Network Automation. IBM Cloud Pak for Network Automation provides multi-vendor and multi-domain service-level orchestration capabilities. It provides orchestration capabilities to directly provision software like xNFs and can also integrate with vendor- or function-specific element managers and controllers for deployment orchestration. The Cloud Pak for Network Automation allows anyone to create behavior tests for test, pre-production, and production environments. Cloud Pak for Network Automation follows intent-driven orchestration where it models the desired service operational state rather than pre-programming workflows.
IBM Cloud Pak for AIOps. IBM Cloud Pak for AIOps is a suite of products designed to manage data, metrics, events, and more in a software runtime environment. The individual components cater to specific needs while being able to work with each other to provide complete support for software runtime infrastructure management and monitoring. In our use case, we used these components of Cloud Pak for AIOps for assurance:
Metric Manager, which monitors and analyzes metrics and KPIs across various technological silos, such as processes, containers, VMs, network links, systems, and so on. The Metric Manager can consume metrics that it collects from these sources to build models for normal operational behavior of these systems and then analyze the metrics in real time to generate alarms when detecting a deviation from normal behavior. These deviations can be processed by other components like the AI Manager for further correlation or the Event Manager to trigger an appropriate action.
AI Manager, which combines infrastructure and operations management into a consolidated structure across various assets including business applications, infrastructure components, virtualized components, network and storage devices, and protocols. It analyzes unstructured data collected from all the resources at run time to provide actionable insights into its faults and failures and to perform root cause analysis. The log anomaly detector collects logs from various sources like LogDNA, Splunk, and so on, to automatically learn normal log patterns from training data, and create a model of normal log behavior, and then perform real-time detection of anomalies through log analysis.
Topology Manager, which is used to fetch and visualize the topology of components and interactions between different components of application and infrastructure services. Topology Manager maintains the topology containing components and their interactions with other components of the system. It dynamically evolves the topology by learning new information through discovery of new components and their interactions with existing parts of the system under study. It also supports manually uploading static topology based on initial build and deployment information of a service.
Event Manager, which monitors and manages events that occur throughout the lifecycle of entire stack of application deployments. It collects, classifies, normalizes, and deduplicates events. It can also perform event enrichment for analytics, event correlation, and event grouping either via manual rules or via built-in algorithms. Event Manager processes the events in real time to provide actionable insights that can be consumed by an orchestration platform to perform specific actions.
A Cognitive Automation component. A Cognitive Automation component adds the power of artificial intelligence (AI) to the self-healing and optimization workflows of the Network Operations Center (NOC). Traditional “closed loop” controls in a NOC consists of workflows that are developed in an external RBA (runbook automation) tool which requires a separate technical team to manage and maintain since NOC requirements are continuously changing. The Cognitive Automation component takes the futuristic approach of using AI to guide machine-to-machine (M2M) communications and to simplify the creation and maintenance of the closed loop or open loop workflows. It simplifies the process to an extent that changes in the workflow can be done by the users such as NOC engineers or business analysts without any programming know-how.
A Cognitive Automation component that can be built with these components:
- IBM Watson Discovery Service. The core natural language processing (NLP) engine of the cognitive automation solution. It provides the base platform to train the NLP models based on the NOC processes and methods of procedures.
- The Event Manager component of Cloud Pak for AIOps. The component that controls the runtime execution of the solution. It receives continuous incoming events from Cloud Pak for AIOps that require cognitive self-healing resolutions.
The network components in our traffic flow optimization use case consist of a set of virtual switches managed by an SDN Controller and orchestrated by IBM Cloud Pak for Network Automation. When an anomaly in the network (such as increased network load on one of the transport tunnels) is detected, you can divert the network traffic from its primary flow to a backup flow proactively, while automatically fixing the issues on the primary flow in parallel. After the issue is fixed, Cloud Pak for AIOps and Cloud Pak for Network Automation can then reroute that traffic back to the primary flow.
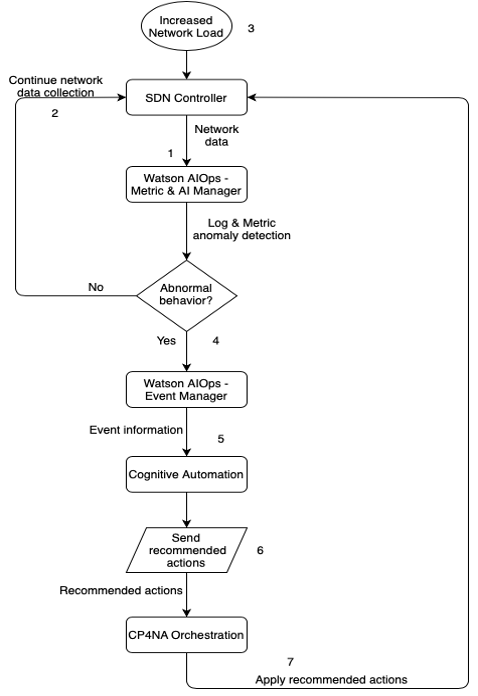
The following figure shows the components in an implementation of a closed-loop automation system for the traffic flow optimization.
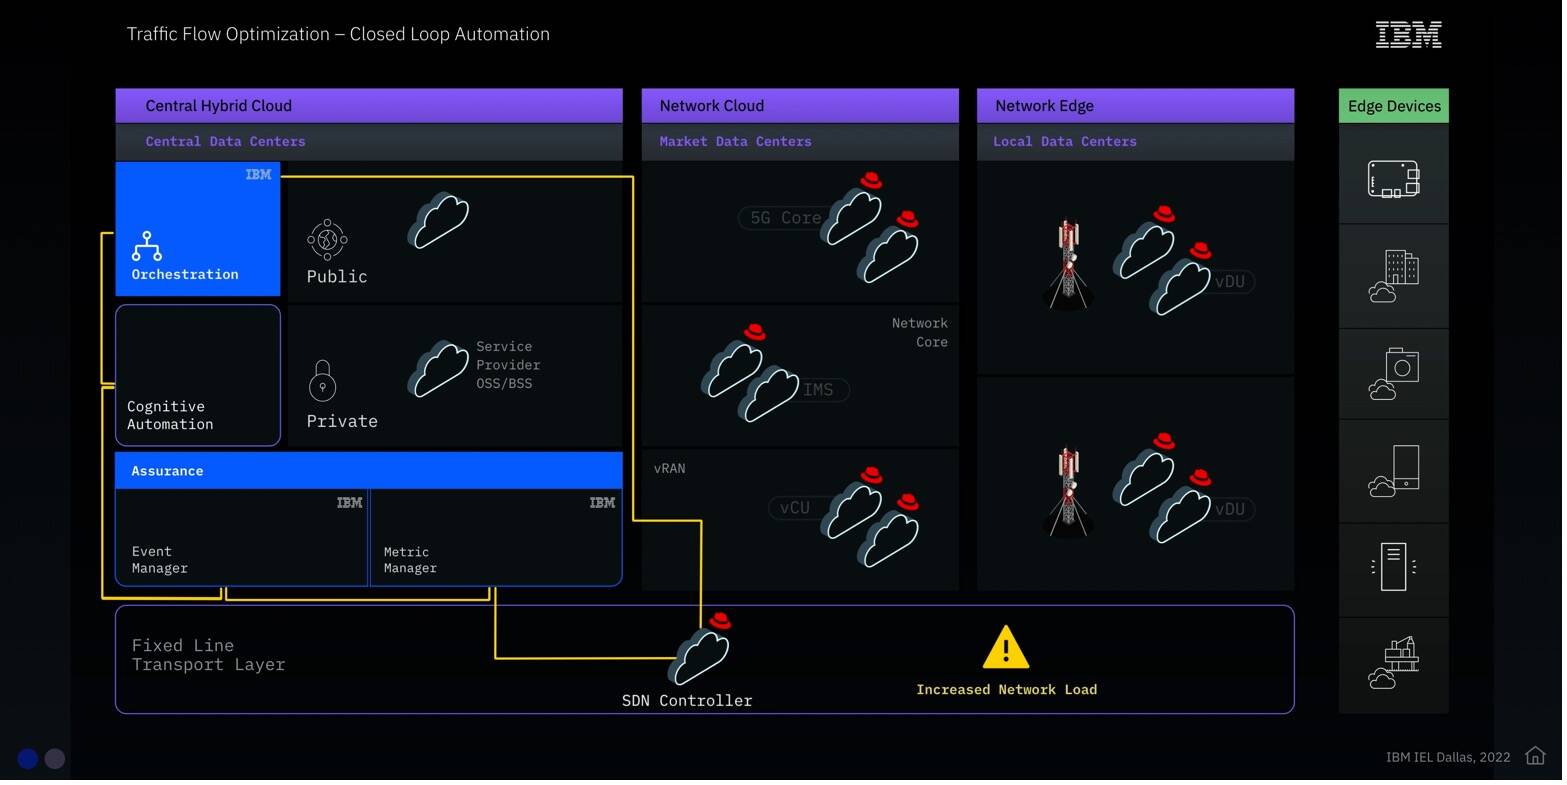
Let’s step through the components of this closed-loop automation system:
- Cloud Pak for AIOps learns the normal behavior of the system by training its Metric Manager on the system metrics and training its AI Manager on the logs of applications under study in the system.
- Based on the model of normal system behavior, both the Metric Manager and AI Manager ingest real-time metrics and logs respectively, analyzing the system for anomalous behavior.
- A network anomaly is created by increasing network load between two of the system nodes.
- Both the Metric Manager and AI Manager are able to detect the anomalous behavior in the system because of a change in the metrics and errors in the logs, and they generate an alarm, which is then sent to the Event Manager.
- The Event Manager displays the alarms on the network events dashboard, which can be monitored by any SME. The Event Manager then sends an alert to the Cognitive Automation component.
- The Cognitive Automation component is trained using documents that contain relevant information on various problems and their solutions. It identifies the appropriate fix for the generated alert and sends an appropriate “next steps execution request” to Cloud Pak for Network Automation.
- Based on the recommended actions by the Cognitive Automation component, Cloud Pak for Network Automation performs the appropriate actions using the SDN Controller on the transport network.
In our traffic flow optimization use case, we train Metric Manager on a standard delay between links connecting nodes of our system. We use the AI Manager’s log anomaly detector to consume logs from all the components of our system and perform anomaly detection in the logs. We use an event grouping service to combine anomalies detected from logs and metrics (using Metric Manager) and then perform fault localization to target closed loop remediation at the specific entity which caused the fault. We consume the topology from the Topology Manager in AI Manager to localize faults to a specific component, the faulty network link between two nodes, which helps in narrowing down of the steps needed to analyze and remediate fault. We use Event Manager to record the faults detected by the AI Manager and Metric Manager and trigger specific actions in relation to switching the network route from its primary route to a backup route when a fault is detected. The Event Manager can track the lifecycle of individual events, maintaining the information if an event has been marked as resolved. We use this information to switch the network back to the primary route.
Let’s now bring together the different components and identify how they come together to create a closed loop automation system.
- We started with provisioning the service using Cloud Pak for Network Automation. After the service had been provisioned and running for some time, we saw the anomaly first appears on our service.
- Metric Manager was then able to identify the deviation in the service metrics, and AI Manager was able to identify errors in the logs being collected from service in real time.
- AI Manager was also able to group metrics and log anomalies together using the event grouping service, and it was able to pinpoint faults to a single node by performing fault localization, and then forward an event with the same information to the Event Manager.
- Event manager then filters and sends an event to our AI running as part of the Cognitive Automation component.
- After the Cognitive Automation component receives the event, it further identifies the specific problem, identifies a solution to the problem with a degree of confidence, and then finally sends the solution to Cloud Pak for Network Automation.
- Cloud Pak for Network Automation executes the steps identified by the Cognitive Automation component and applies them to our service, which triggers a “heal intent” that restores the service to its correct configuration which finishes the closed loop automation.
How Cloud Pak for AIOps enables closed-loop automation systems
As you can see, Cloud Pak for AIOps enables you to analyze data from across your runtime ecosystem, in order to consume metric, log, event, and topology data to correlate, predict, and address network issues before they impact the performance of your environment. You can use metrics, logs, and topology information to identify the source of failure in a real-world network function deployment.
Now, let’s explore in detail the following capabilities of closed-loop automation systems that use these Cloud Pak for AIOps components:
- Detecting metric anomalies in Metric Manager
- Detecting log anomalies n AI Manager
- Combining metric and log anomalies in the Event Grouping Service
- Localizing the fault to a particular node by using the topology in Topology Manager
- Triggering the closed-loop action via event information sent to Event Manager.
In the closed-loop automation use case for traffic flow optimization, the high-level flow chart illustrates how we configured Cloud Pak for AIOps to process event, metric, and log data to determine actionable insights and run necessary actions.
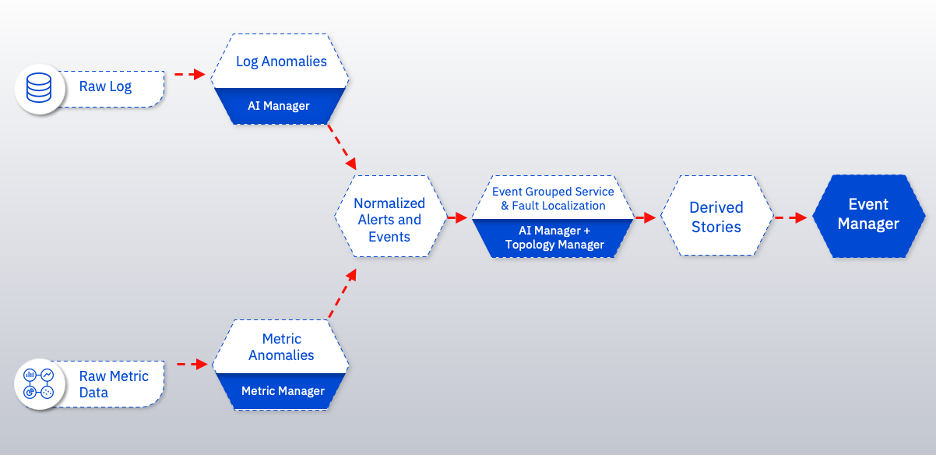
During configuration and training, the AI Manager creates models by training on log data from applications, infrastructure, and the network. The Metric Manager is trained on performance metric data to create a model familiar with normal operating behavior of the KPIs. During operations, log data is analyzed by the AI Manager while time-series metric data is analyzed by the Metric Manager in parallel processes.
After the AI Manager and Metric Manager generate alerts, the Event Grouping Service (of AI Manager) ingests the generated alerts to group-related events into a single event output. The Event Grouping Service uses topology information from the Topology Manager to identify the root cause by using fault localization as well as to calculate any neighboring nodes in the blast radius that are affected by the fault.
This single actionable event (called a derived story in our flow chart) can be shared with a subject matter expert (SME) through ChatOps like Slack, PagerDuty, or an automated system like the Event Manager (in Cloud Pak for AIOps) or Cloud Pak for Network Automation, which is what we used in this traffic flow optimization use case.
The final flow in the chart shows the Event Manager, which can organize, deduplicate, and track events through the event’s entire lifecycle. The Event Manager also maintains what actions to take for different events and triggers follow-up actions. The event information can then be shared with other tools like Cloud Pak for Network Automation to take specific actions to address and resolve the fault. Now, let’s explore the individual components of Cloud Pak for AIOps and their role in providing closed-loop automation in the traffic flow optimization use case.
Handling system metrics
We use the Metric Manager to build a model of the normal operating behavior of the time series data that is collected from system metrics and to detect anomalies at run time. The Metric Manager’s anomaly detection algorithms use numerous statistical and analytics techniques to detect anomalies.
During training, the analytics algorithm analyzes the metrics in the source data to learn about the behavior and creates a mathematical model of what was learned based on the data in their training window. An algorithm is trained when a metric has sufficient data to train. A model is created only if the available data can be modeled accurately by the algorithm. The model is rejected in the validation step if the algorithm is not able to build an accurate mathematical model. Retraining of these algorithms is done at a regular interval value to update the mathematical model so that it represents the metric data as accurately as possible.
After an algorithm creates a model for a metric, it can detect anomalies in the data that it receives for that metric at subsequent intervals. It compares subsequent data that is extracted with data in the model so it can identify any changes in system behavior.
Metric anomaly detection
After an algorithm trains and creates a model for a metric, it compares the value of the metric with the model information at each interval. If a metric's value fits within the model information, the algorithm takes no further action. However, if the metric's value deviates from the model information, the algorithm detects an anomalous pattern. The algorithm then uses various properties such as the minimum number of intervals that a metric must be anomalous to determine whether to output an anomaly event.
By default, an algorithm sends an anomaly event if it detects an anomalous pattern for a metric on 3 of the previous 6 intervals at which data was received. Therefore, the Metric Manager only generates anomalies when it is fully confident that anomalous behavior is occurring and is worth investigating.
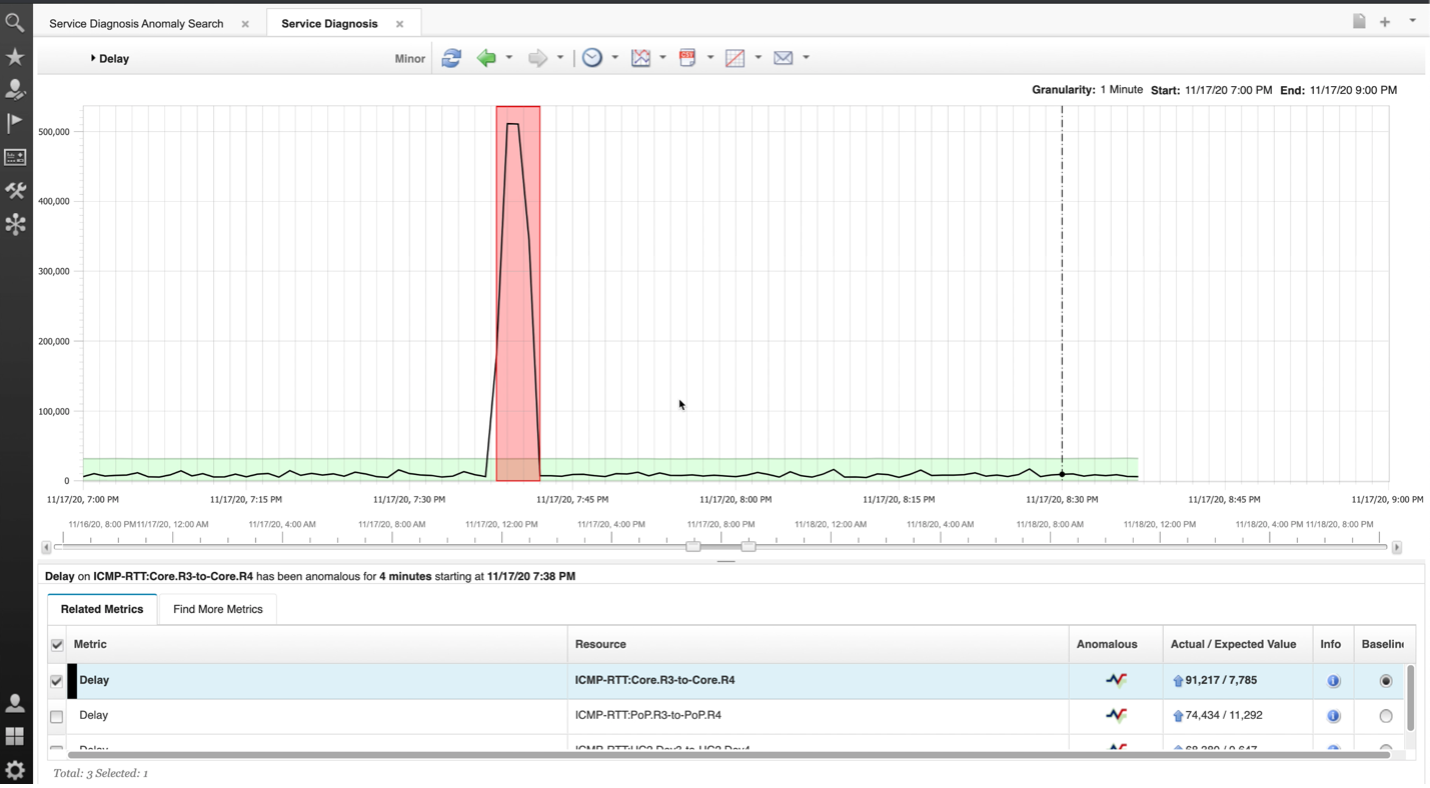
For the traffic flow optimization use case, the data source is performance metrics (raw metric data) from all of the nodes of our system. The Metric Manager analyzes this time series metric data from the SDN Controller and can detect anomalies, as shown in the following image. The image shows an anomaly being detected on the ICMP Round Trip Time delay between two of the nodes in the topology (Core.R3 and Core.R4). The detected anomaly shows a deviation from normal values.
Handling system logs
In our use case, we use the AI Manager's log anomaly detector to consume logs from all components of our system and perform log-based anomaly detection. The logs that are collected from services in our environment are in a rsyslog format and are being fed to the AI Manager as input.
The following figure is an example of raw logs that are collected from our infrastructure.

Normalization
The AI Manager consumes data from various sources such as logs, events, and tickets, and must normalize or standardize that data in a common format for better handling of the information that is present in the input data.
In the case of logs, normalization is performed by converting the input rsyslog to a closely resembled logging format such as a LogDNA format.
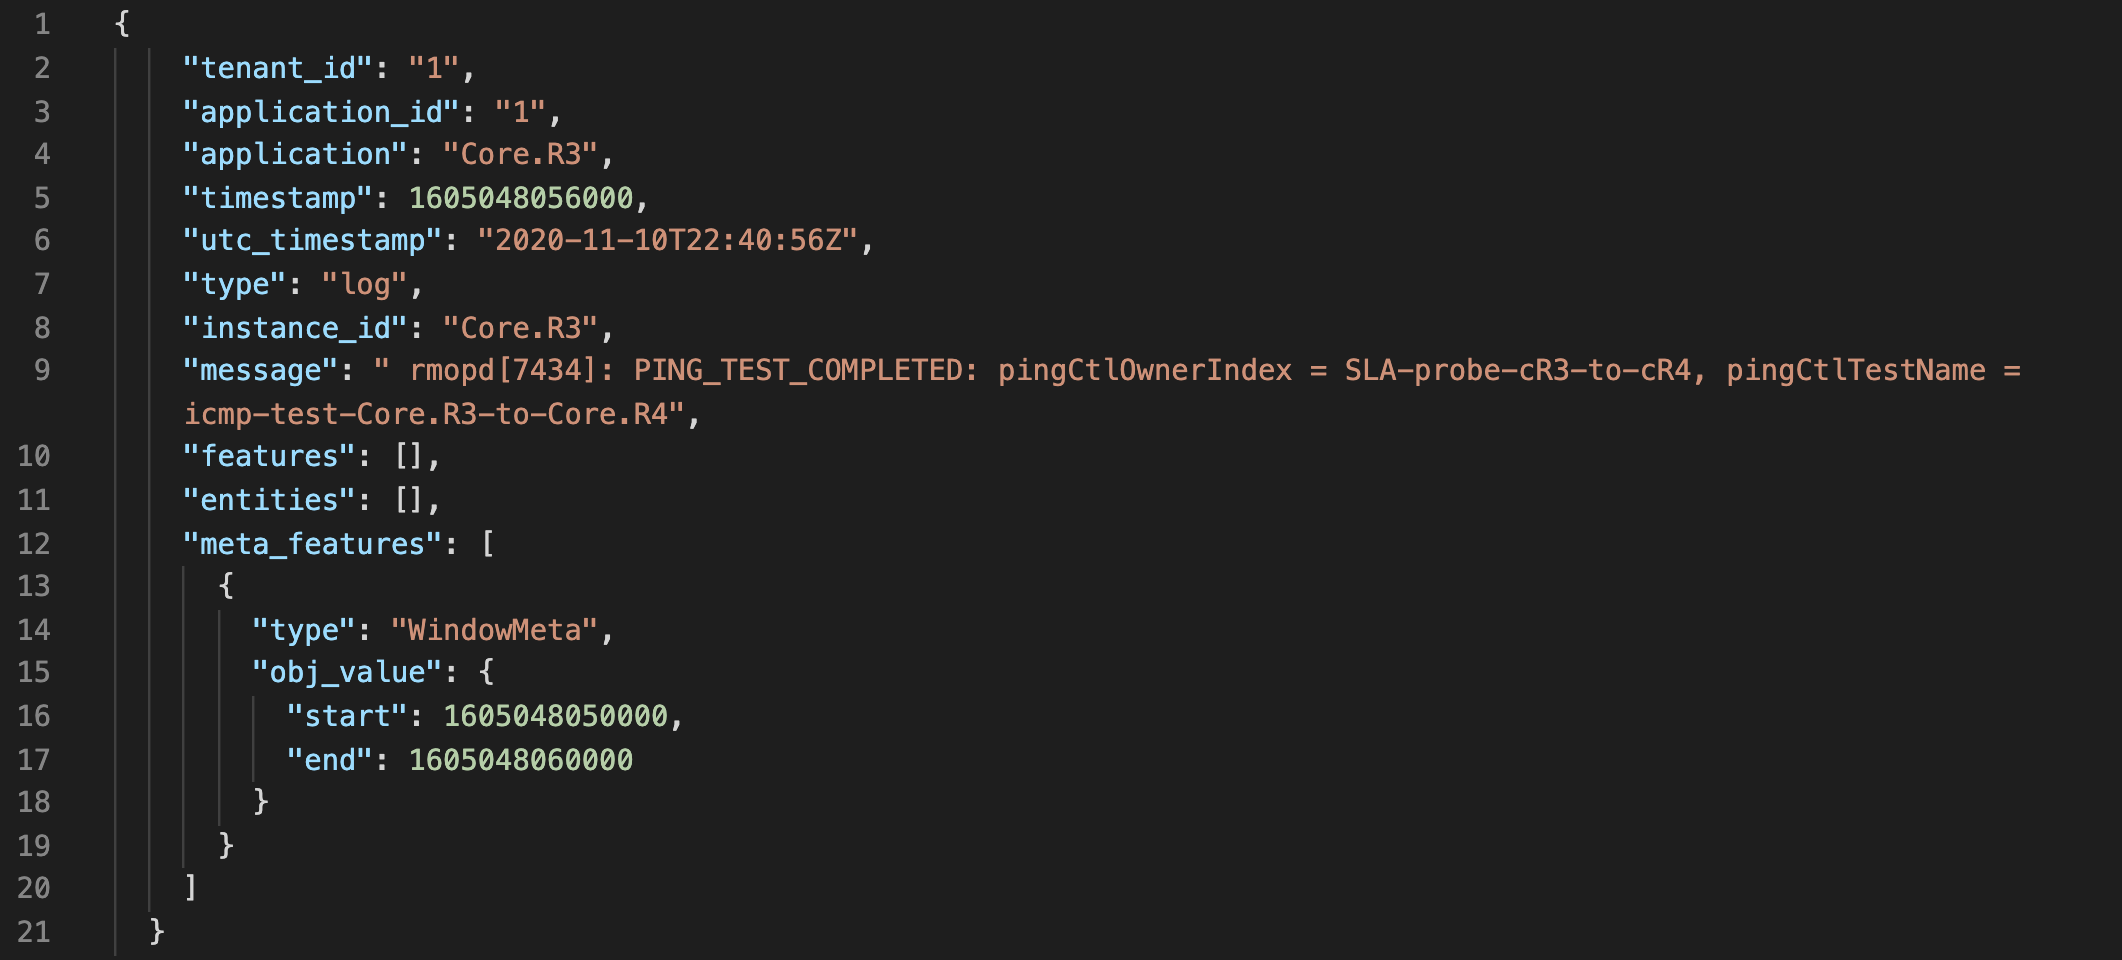
The following image shows an example of the normalized log. In this case, corresponding to the first line in the raw log shown in previous image.
Templatization
After normalization, the input logs are passed to the templatization engine. A template is a generic message string that generates many lines in the log output. Templatization also detects the position of parameters that are present in the lines.
The templatization engine first runs the lines of the log file through a classifier that classifies the lines in erroneous or non-erroneous groups, which helps separate lines pertaining to the healthy state of the system. A template miner then runs the lines through a pretrained model to map lines to templates and generates different IDs for each unique template. So, each line in the log file is mapped to a template ID. The following figure is a template that is extracted by the templatization engine while parsing logs of our system.
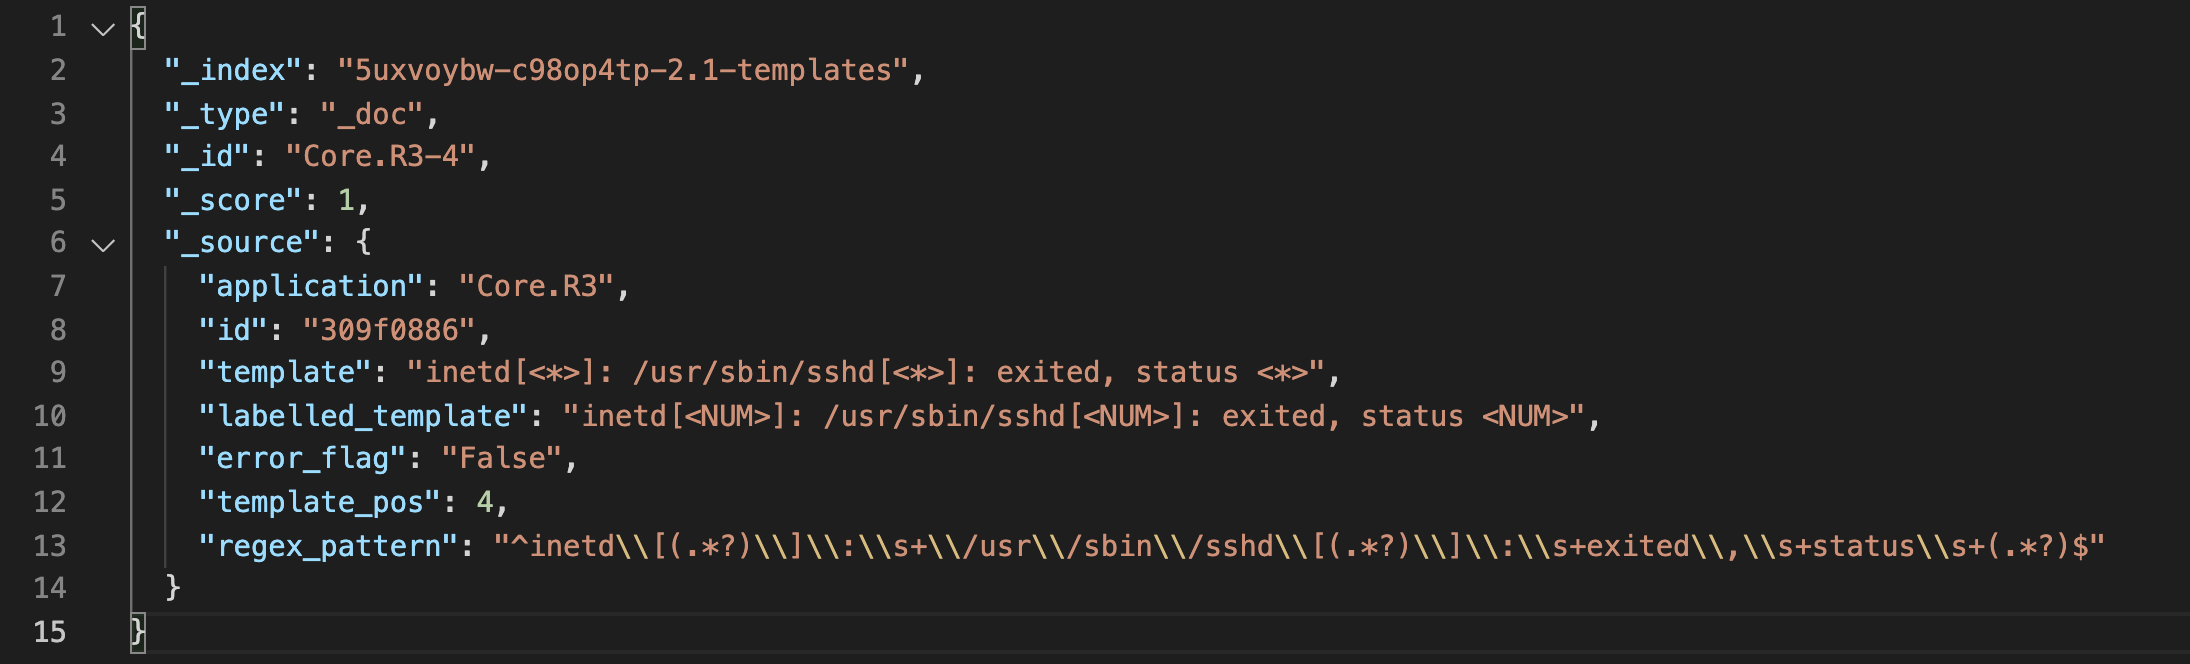
The template subfield in this example shows the text that forms the base for this line of the log file, the pid of processes, and the exit_status code are being detected as parameters. The original log line for this template looked like inetd[7362]: /usr/sbin/sshd[31282]: exited, status 255.
The example also shows that the classifier detected this line as a non-erroneous line, as shown by "error_flag": “False”.
Training for logs
The AI Manager must be trained on sample logs from a “healthy” system state to create a model of the normal behavior of the system logs. While training, the AI Manager runs the training logs through normalization and templatization, creating a model of unique templates that are seen in the logs. It also collects information about how frequently each unique log template occurs in the training data. This model is created specific to each unique entity that is detected in the input data that generated the log output, such as Core.R3 and Core.R4.
Log anomaly detection
We feed logs from various components of our system into the AI Manager in real time. The AI Manager converts them to normalized logs that are then run through the templatization engine in batches called windows of logs.
For each window, a count_vector is generated, which maintains the occurrence frequency of various templates present in the log output. Data that is collected in each window is then compared to the healthy state of the system model that was created while training. A deviation of the system from the healthy state is detected as an anomaly. For example, the presence of a new log template (an error template) is identified by the log anomaly detector as a log anomaly, which is then consumed by the event grouping service.
Handling system topology
In the traffic flow optimization use case, we use the Topology Manager, to generate a topology database through active discovery of networks, the active discovery of networks, connections, and applications, and by using the existing sources or known connections.
The Topology Manager allows DevOps personnel, SREs, and operations team members to have real-time visibility of complex distributed workloads and infrastructures by observing the interactions and connections in the form of a topology. The topology also helps teams to quickly find the blast radius (distance from the source of a fault to other components) of an issue, distinguishing symptoms and root causes, and visualizing topology changes over time, all of which help teams discover any deviations in the topology.
The following figure is a snapshot of the topology of our traffic flow optimization use case.
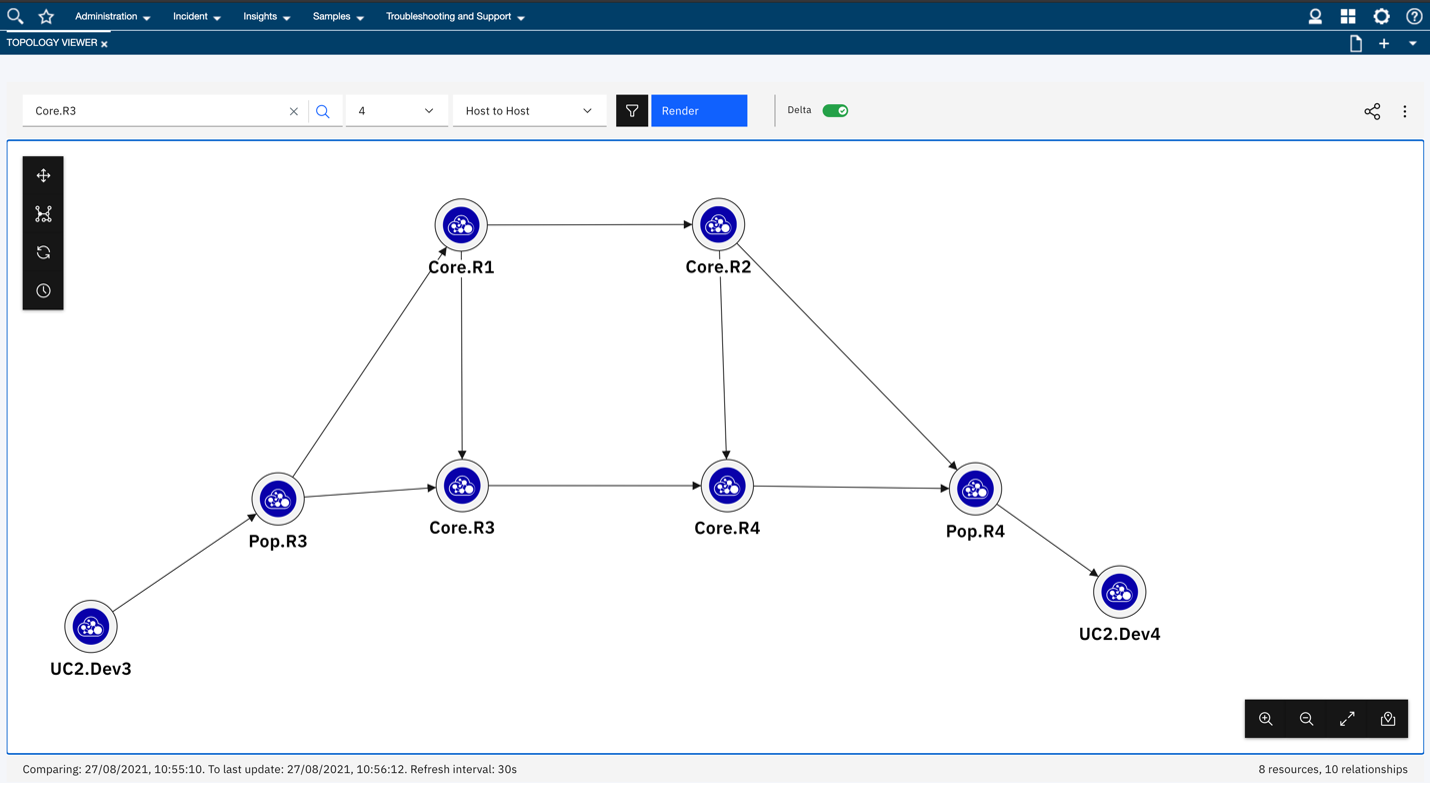
The topology is stored in the form of a graph, where nodes represent an application, a service, or a component of an application or the infrastructure, and the edges represent the interaction relationships between them. The topology uses various edge labels and edge types such as memberOf, runsOn, and accessedVia. In the traffic flow optimization use case, we have a simple dependsOn relationship based on the direction of traffic flow between the nodes.
The following image shows the topology in a JSON format, which shows all of the nodes and the relationships among them.

Combining metric and log anomalies
The AI Manager’s Event Grouping Service groups alerts coming from various sources that pertain to the same fault to provide a better understanding and analysis of the root cause of the fault. It also localizes the fault to a point of failure and performs impact domain (blast radius) calculations.
The Event Grouping Service applies multiple algorithms to group alerts. Temporal grouping is applied to alerts that have a strong correlation with respect to the proximity of their occurrence time to the entities that throw the error logs. Template grouping is applied to alerts that have a similar description. For example, if the underlying log lines (more accurately, templates) that are present in two alerts are similar, then it’s possible that a failure at one place causes the same error to be thrown by upstream or downstream services.
For temporal grouping, the system uses the occurrence time of two alerts to group them together, but the alerts can also be grouped if the log line corresponding to the error in different alerts was emitted by the same entity (code/module/node).
For template grouping, the system considers each different entity which emitted a log line (for example, Core.R3 and Core.R4) in the alert window, and then calculates a similarity score for log templates emitted by each entity across the alerts. A strong similarity score forms the basis of a template-based cluster of alerts.
The Event Grouping Service applies these algorithms to all alerts until no more correlation is possible or a single alert group is formed.
Fault localization
As the name suggests, fault localization is defined as a process tracing back the fault propagation and pinpointing the faulty component among many components in a complex distributed system.
After grouped alerts (where anomalies are grouped together) are generated by the Event Grouping Service, entities mentioned in each grouped anomaly along with the dependency graph from the Topology Manager are used to perform fault localization and blast radius calculation.
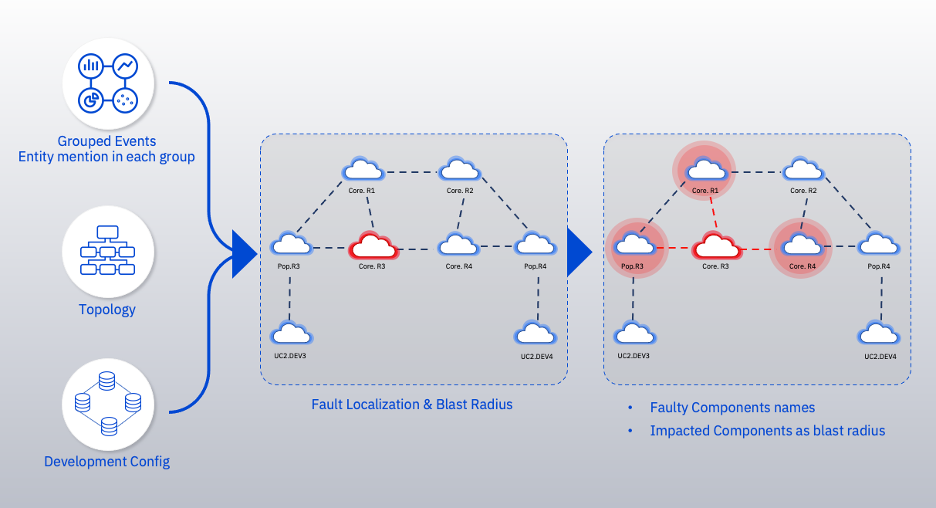
The following sample output from the Event Grouping Service in the traffic flow optimization use case shows fault localization of the output.
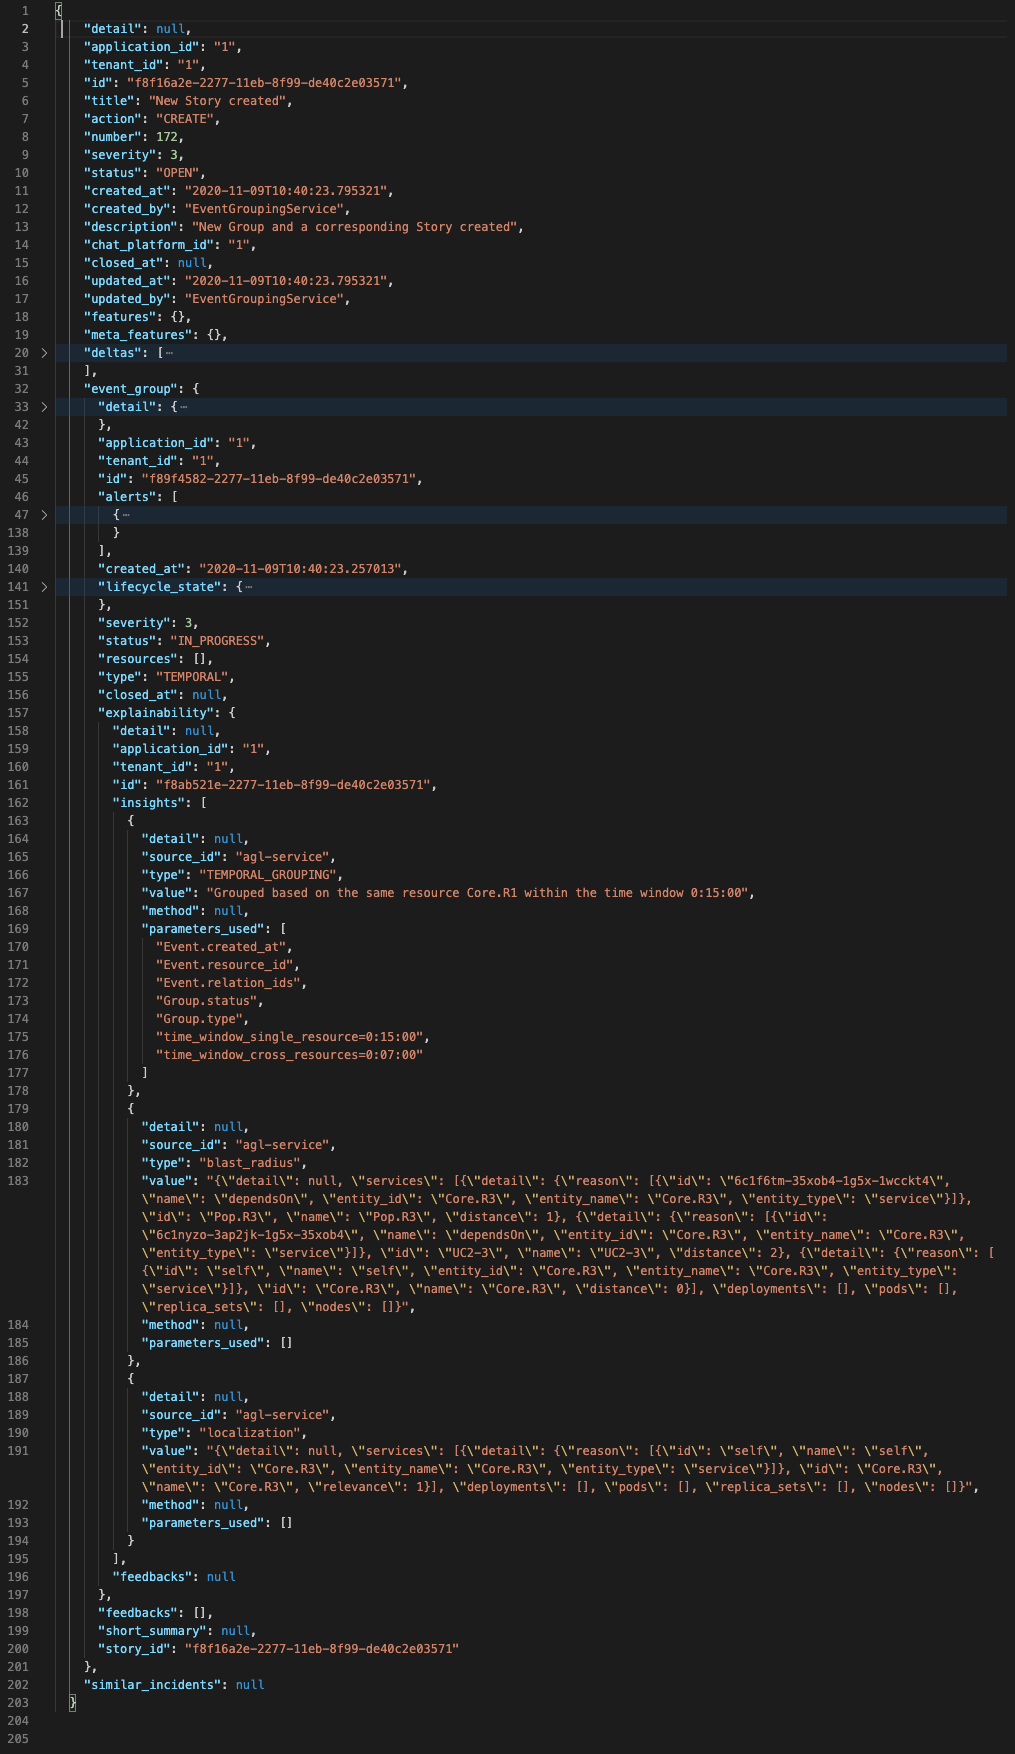
After performing event grouping and fault localization, the AI Manager sends a single actionable event as the output to trigger further action.
Handling generated events
In the traffic flow optimization use case, we used the Event Manager to combine and deduplicate the received alerts and events, while tracking the lifecycle of the event through remediation and resolution actions.
The Event Manager maintains which actions to take in response to different events and triggers follow-up events as needed.
In our use case, the event that is detected by the AI Manager’s Event Grouping Service is sent as input into our Event Manager. The Event Manager can consolidate this further with events from other sources. The events are consolidated, normalized, and stored in an in-memory database called the Object Server. As the Event Manager tracks an event through its lifecycle, it appropriately prioritizes the incident and trigger actions or policies on other tools and systems.
The following figure is a screen capture of one of the events in the Event Manager dashboard.

In our traffic flow optimization use case, the Event Manager triggers remediation by sending the event to our Network Operations Center. As the remediation steps take place, it tracks the active anomaly through any changes until it is resolved, at which point it can trigger additional follow-up actions or notifications, completing the closed-loop scenario.
Summary
In this article, we introduced closed-loop automation and the problems it helps solve. We then looked at multiple use cases of closed-loop automation in areas such as Kubernetes and security. Then, we presented a detailed description of a traffic flow optimization use case and explained how different IBM products like Cloud Pak for Network Automation, Cloud Pak for AIOps, and a Cognitive Automation component work together and enable a closed loop automation system in a real-time.
Finally, we described how in a real-world system, basic signals like logs and performance metrics that are collected from the application and infrastructure can be used to detect faults and errors at run time. The topology of the system along with any fault information can be used to pin-point the fault to a specific entity. The fault can then be tracked through its entire lifecycle, providing an SME with an entire view of fault detection and fault remediation through automated or manual steps. Thus, the components of IBM Cloud Pak for AIOps help to deliver a closed-loop automation system.
While Cloud Pak for AIOps provides a suite of products and components, we focused on the tools that helped us enable the traffic flow optimization use case. Your enterprise can extend this architecture to any complex use case like IP Multimedia Subsystem (IMS) or 5G Core deployments.
Acknowledgements
This article was truly a team effort. It was written, reviewed, and updated by this set of authors:
- Sharath Prasad
- Mathews Thomas
- Amandeep Singh
- Sai Srinivas Gorti
- Praveen Jayachandran
- Juel Raju
- Dushyant Behl
- Sujay Som
- Trey Lewis
- Mudit Verma
- Eric Gose
- Utpal Mangla