Article
An introduction to the Unified Modeling Language
Learn about the most important UML diagrams used in the visual modeling of softwareWay back in the late twentieth century -- 1997 to be exact -- the Object Management Group (OMG) released the Unified Modeling Language (UML). One of the purposes of UML was to provide the development community with a stable and common design language that could be used to develop and build computer applications. UML brought forth a unified standard modeling notation that IT professionals had been wanting for years. Using UML, IT professionals could now read and disseminate system structure and design plans -- just as construction workers have been doing for years with blueprints of buildings.
It is now the twenty-first century and UML has gained traction in our profession. On 75 percent of the resumes I see, there is a bullet point claiming knowledge of UML. However, after speaking with a majority of these job candidates, it becomes clear that they do not truly know UML. Typically, they are either using it as a buzz word, or they have had a sliver of exposure to UML. This lack of understanding inspired me to write this quick introduction to UML, focused on the basic diagrams used in visual modeling. When you are finished reading you will not have enough knowledge to put UML on your resume, but you will have a starting point for digging more deeply into the language.
Now, some twenty years after writing this UML article series, I am happy to discover that (due to no master plan on my part) this UML article series is still relevant. Sure, the examples in the articles are a bit dated, but I still must communicate software and system designs in diagram form on a daily to weekly basis. This happy accident reminded me of when I read Fred Brooks’s The Mythical Man-Month: Essays on Software Engineering in 2008, which was over 30 years old when I read it. An IT book that was completely relevant after 30 years was jaw dropping to me. Sure, the book’s examples were a bit dated like bell-bottom jeans and track suits, but all the points were applicable to my software engineering day job in 2008 (and still relevant today in 2023). Our IT field has advanced tremendously over the 50 years but the core themes and problems in Fred Brooks’s book and this UML article series still exist today. Oh, and just a friendly reminder: Your code, designs, and writeups tend to last a lot longer than you might ever expect!
A little background
As I mentioned, UML was meant to be a unifying language enabling IT professionals to model computer applications. The primary authors were Jim Rumbaugh, Ivar Jacobson, and Grady Booch, who originally had their own competing methods (OMT, OOSE, and Booch). Eventually, they joined forces and brought about an open standard. (Sound familiar? A similar phenomenon spawned J2EE, SOAP, and Linux.) One reason UML has become a standard modeling language is that it is programming-language independent. (UML modeling tools are used extensively in J2EE shops as well in .NET shops.) Also, the UML notation set is a language and not a methodology. This is important, because a language, as opposed to a methodology, can easily fit into any company's way of conducting business without requiring change.
Since UML is not a methodology, it does not require any formal work products. Yet it does provide several types of diagrams that, when used within a given methodology, increase the ease of understanding an application under development. There is more to UML than these diagrams, but for my purposes here, the diagrams offer a good introduction to the language and the principles behind its use. By placing standard UML diagrams in your methodology's work products, you make it easier for UML-proficient people to join your project and quickly become productive. The most useful, standard UML diagrams are: use case diagram, class diagram, sequence diagram, statechart diagram, activity diagram, component diagram, and deployment diagram.
It is beyond the scope of this introductory article to go into great detail about each type of diagram. Instead, I will provide you with enough information for a general understanding of each one and then supply more details in later articles.
Use-case diagram
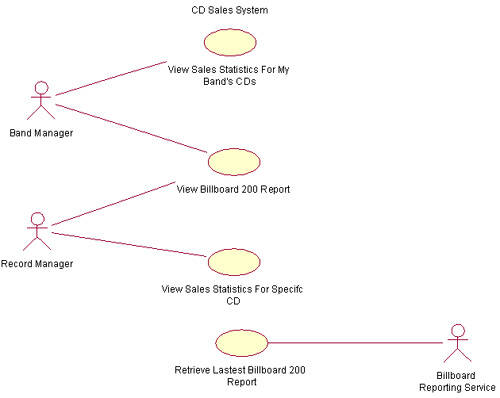
A use case illustrates a unit of functionality provided by the system. The main purpose of the use-case diagram is to help development teams visualize the functional requirements of a system, including the relationship of "actors" (human beings who will interact with the system) to essential processes, as well as the relationships among different use cases. Use-case diagrams generally show groups of use cases — either all use cases for the complete system, or a breakout of a particular group of use cases with related functionality (for example, all security administration-related use cases). To show a use case on a use-case diagram, you draw an oval in the middle of the diagram and put the name of the use case in the center of, or below, the oval. To draw an actor (indicating a system user) on a use-case diagram, you draw a stick person to the left or right of your diagram (and just in case you're wondering, some people draw prettier stick people than others). Use simple lines to depict relationships between actors and use cases, as shown in the following figure.
Figure 1. Sample use-case diagram
The example statechart diagram shows some of the potential information they can communicate. For instance, you can tell that loan processing begins in the Loan Application state. When the pre-approval process is done, depending on the outcome, you move to either the Loan Pre-approved state or the Loan Rejected state. This decision, which is made during the transition process, is shown with a decision point — the empty circle in the transition line. By looking at the example, a person can tell that a loan cannot go from the Loan Pre-Approved state to the Loan in Maintenance state without going through the Loan Closing state. Also, by looking at our example diagram, a person can tell that all loans will end in either the Loan Rejected state or the Loan in Maintenance state.
Activity diagram
Activity diagrams show the procedural flow of control between two or more class objects while processing an activity. Activity diagrams can be used to model higher-level business process at the business unit level, or to model low-level internal class actions. In my experience, activity diagrams are best used to model higher-level processes, such as how the company is currently doing business, or how it would like to do business. This is because activity diagrams are "less technical" in appearance, compared to sequence diagrams, and business-minded people tend to understand them more quickly.
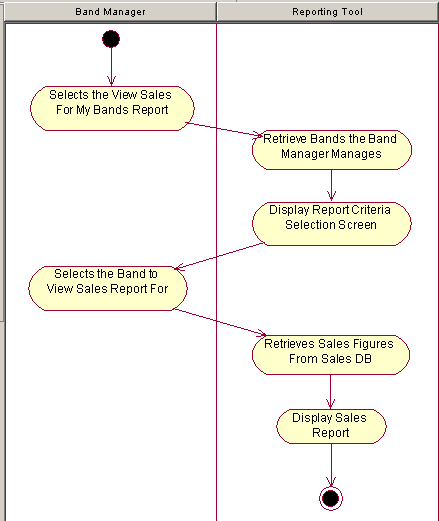
An activity diagram's notation set is similar to that used in a statechart diagram. Like a statechart diagram, the activity diagram starts with a solid circle connected to the initial activity. The activity is modeled by drawing a rectangle with rounded edges, enclosing the activity's name. Activities can be connected to other activities through transition lines, or to decision points that connect to different activities guarded by conditions of the decision point. Activities that terminate the modeled process are connected to a termination point (just as in a statechart diagram). Optionally, the activities can be grouped into swimlanes, which are used to indicate the object that actually performs the activity, as shown in the following figure.
Figure 2. Activity diagram, with two swimlanes to indicate control of activity by two objects: the band manager, and the reporting tool
Deployment diagram
The deployment diagram shows how a system will be physically deployed in the hardware environment. Its purpose is to show where the different components of the system will physically run and how they will communicate with each other. Since the diagram models the physical runtime, a system's production staff will make considerable use of this diagram.
The notation in a deployment diagram includes the notation elements used in a component diagram, with a couple of additions, including the concept of a node. A node represents either a physical machine or a virtual machine node (for example, a mainframe node). To model a node, simply draw a three-dimensional cube with the name of the node at the top of the cube. Use the naming convention used in sequence diagrams: (instance name) : (instance type) (for example, "w3reporting.myco.com : Application Server").
Figure 8. Deployment diagram
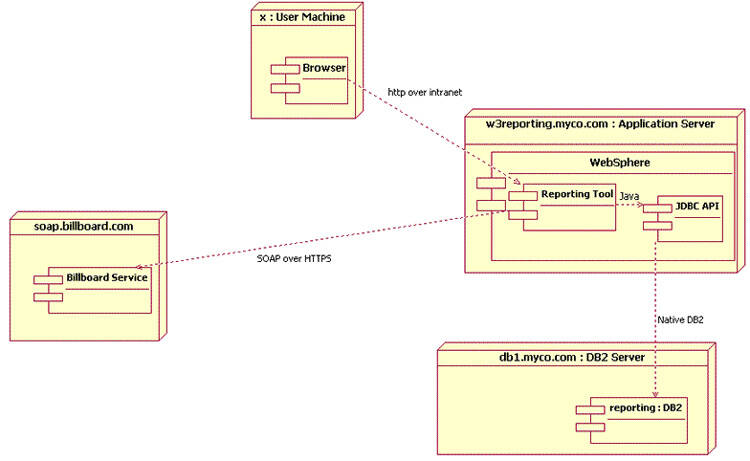
The sample deployment diagram shows that the users access the Reporting Tool by using a browser running on their local machine and connecting via HTTP over their company's intranet to the Reporting Tool. This tool physically runs on the Application Server named w3reporting.myco.com. The diagram shows the Reporting Tool component drawn inside of IBM WebSphere, which in turn is drawn inside of the node w3.reporting.myco.com. The Reporting Tool connects to its reporting database using the Java language to IBM DB2's JDBC interface, which then communicates to the actual DB2 database running on the server named db1.myco.com using native DB2 communication. In addition to talking to the reporting database, the Report Tool component communicates via SOAP over HTTPS to the Billboard Service.
Conclusion
Although this article provides only a brief introduction to Unified Modeling Language, I encourage you to start applying the information you have learned here to your own projects and to dig more deeply into UML. There are several software tools that help you to integrate UML diagrams into your software development process, but even without automated tools, you can use markers on a whiteboard or paper and pencils to draw your UML diagrams and still achieve benefits.
Explore more about UML in these articles in the UML Basics series: