Article
Network overview - Monitoring the hardware
Part 1 of the series - Optimizing AIX 7 network performanceArchive date: 2024-07-05
This content is no longer being updated or maintained. The content is provided “as is.” Given the rapid evolution of technology, some content, steps, or illustrations may have changed.About this series
Part 1 of this three-part series on AIX networking provides a networking overview and discusses the tools that help you monitor your hardware. Part 2 covers tuning the Network File System (NFS) with monitoring utilities, such as nfsstat and nmon, and it also goes over how to tune with nfso. Part 3 shows you how to monitor network packets and how to use netstat for this purpose. You'll learn how to tune your network subsystem using the no utility. This series also expounds on various best practices of network I/O performance tuning.
Introduction
The first thing that usually comes to mind when a system administrator hears that there might be some network contention issues is to run netstat. netstat, the equivalent of using vmstat or iostat for your memory reports, is a quick way to get an overview of how your network is configured. Unlike vmstat or iostat, the defaults usually do not give you as much information as you probably would like. You need to understand the correct usage of netstat and how best to utilize it when monitoring your system.
netstat is really not a monitoring tool in the sense of vmstat and iostat. You can use other tools more suitable (discussed later in the article) to help monitor your network subsystem. At the same time, you can't really start to monitor unless you have a thorough understanding of the various components related to network performance. These components include your network adapters, your switches and routers, and how you are using virtualization on your host logical partitions. If you determine you are indeed having a network bottleneck, fixing the problem might actually lay outside of your immediate host machine. There is little you can do if the network switch is improperly configured on the other end. Of course, you might be able to point the network team in the right direction. You should also spend time gathering overall information about your network. How are you going to be able to understand how to troubleshoot your network devices unless you really understand your network? In this article, you'll look at specific AIX network tracing tools, such as netpmon, and how they can help you isolate your bottlenecks.
Finally, no matter which subsystem you are looking to tune, you must think of systems tuning as an ongoing process. As stated before, the best time to start monitoring your systems is at the beginning, before you have any problems and users aren't screaming. You must have a baseline of network performance so that you know what the system looks like when it is behaving normally. Finally, when making changes, be careful to make changes only one at a time so that you can really assess the impact of your change.
Network I/O overview
This section provides an overview of the network as it relates to AIX 7 and covers the physical aspects of the network (device drives and adapters), the AIX networking stack, and how to make some changes to your adapter.
Understanding the network subsystem, as it relates to AIX, is not an easy undertaking. When examining the CPU and memory bottlenecks, there are far fewer areas that you need to examine from a hardware and software aspect. Disk I/O tuning is more complex, as there are many more issues that impact performance, particularly during the architectural and build-out of your systems. In this respect, tuning your network is probably most like tuning your disk I/O, which is actually not too surprising, as they both relate to I/O. Let's start.
Figure 1 illustrates the AIX Transmission Control Protocol/Internet Protocol (TCP/IP) layers.
Figure 1. The AIX TCP/IP layers
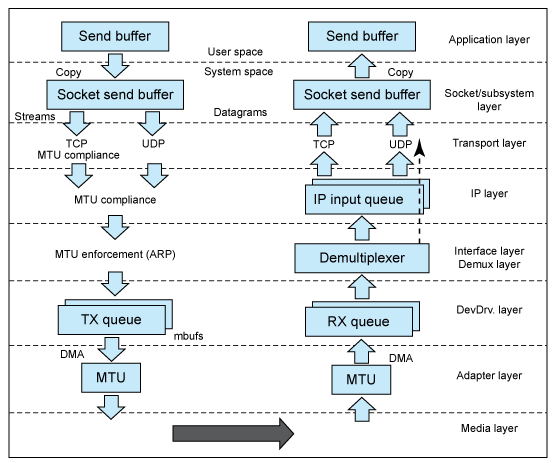
Figure 1 illustrates that there is more to network monitoring than running netstat and looking for collisions. From the application layer through the media layer, there are areas that need to be configured, monitored, and tuned. At this point, you should notice some similarities between this illustration and the Open Systems Interconnection Basic Reference Model (OSI Model). The OSI Model has seven layers (bottom to top):
- Physical
- Data-link
- Network
- Transport
- Session
- Presentation
- Application
Perhaps the most important concept to understand is that on the host machine each layer communicates with its corresponding layer on the remote machine. The actual application programs transmit data using either User Datagram Protocol (UDP) or Transmission Control Protocol (TCP) transport layer protocols. They receive the data from whatever application you are using and divide them into packets. The packets themselves differ, depending on whether it is a UDP or TCP packet. Generally speaking, UDP is faster, while TCP is more secure. There are many tunable parameters to look at — you'll get to these parameters during subsequent phases of the series. You might want to start to familiarize yourself with the no command, which is the utility designed to make the majority of your network changes. From a hardware perspective, it is critical that you understand the components that need to be configured appropriately to optimize performance. Though you might work together with the network teams that manage your switches and routers, it is unlikely that you will be configuring them (unless you are a small shop or a one-person IT department). The most important component you will be working with is your network adapter. Gigabit Ethernet is now the standard network interface, although 10Gbit network cards and infrastructure is becoming more accessible.
Maximum Transfer Unit
Maximum Transfer Unit (MTU) is defined as the largest packet that can be sent over a network. The size depends on the type of network. For example, 16-bit token ring has a default MTU size of 17914, while Fiber Distributed Data Interface (FDDI) has a default size of 4352. Ethernet has a default size of 1500 (9000 with jumbo frames enabled). Larger packets require less packet transfers, which result in higher bandwidth utilization on your system. In particular, using jumbo frames allows for an entire 8KB NFS block to be exchanged in a single packet, which can significantly improve performance. An exception to this is if your application prefers smaller packets, and this includes web applications on the Internet, since most Internet connections do not support jumbo frames. If you are using a Gigabit Ethernet, you can use a jumbo frames option. To support the use of jumbo frames, it's important to note that your switch must also be configured, accordingly.
To change to jumbo frames, use this fastpath: # smit devices.
Then go to Communication>Ethernet>Adapter>Change/show characteristics of an Ethernet adapter. Try to change the transmit jumbo frames option from "No" to "Yes" (see Listing 1).
Listing 1. Characteristics of an Ethernet adapter screen
              Change / show characteristics of an Ethernet adapter
                        Change / Show Characteristics of an Ethernet Adapter
Type or select values in entry fields.
Press Enter AFTER making all desired changes.

                                                     [Entry Fields]
  Ethernet Adapter                                 ent0
  Description                                      Virtual I/O Ethernet Adapter (l-lan)
  Status                                           Available
  Location
  Enable ALTERNATE ETHERNET address                no                                +
  ALTERNATE ETHERNET address                      [0x000000000000]                   +
  Minimum Tiny Buffers                            [512]                              +#
  Maximum Tiny Buffers                            [2048]                             +#
  Minimum Small Buffers                           [512]                              +#
  Maximum Small Buffers                           [2048]                             +#
  Maximum Medium Buffers                          [128]                              +#
  Maximum Medium Buffers                          [256]                              +#
  Minimum Large Buffers                           [24]                               +#
  Maximum Large Buffers                           [64]                               +#
  Minimum Huge Buffers                            [24]                               +#
  Maximum Huge Buffers                            [64]                               +#
  Transmit Copy Buffers                           [32]                               +#
  Transmit Copy Buffer Size                       [65536]                            +#
  Trace Debug Enable                               no                                +
  Checksum Offload Enable                          yes                               +
  I/O memory entitlement reserved for device       0
  Apply change to DATABASE only                    no                                +
Where is the jumbo frames option? In this case, you cannot make the change. The reason for this is because you are only using the Virtual I/O Ethernet on this system — this topic is discussed in more detail later.
On a system where you have direct access to the network hardware, check the system using Listing 2.
Listing 2. Checking the system
              Change / show characteristics of an Ethernet adapter

Type or select values in entry fields.
Press Enter AFTER making all desired changes.

                                                        [Entry Fields]
  Ethernet Adapter                                    ent1
  Description                                         10/100/1000 Base-TX P>
  Status                                              Available
  Location                                            1j-08
  RX descriptor queue size                           [1024]                  +#
  TX descriptor queue size                           [1024]                  +#
  Software transmit queue size                       [8192]                  +#
  Transmit jumbo frames                               yes                    +
  Enable hardware TX TCP resegmentation               yes                    +
  Enable hardware transmit and receive checksum       yes                    +
  Media speed                                         Auto_Negotiation       +
  Enable ALTERNATE ETHERNET address                   no                     +
  ALTERNATE ETHERNET address                         [0x000000000000]        +
  Apply change to DATABASE only                       no                     +

F1=Help             F2=Refresh          F3=Cancel           F4=List
F5=Reset            F6=Command          F7=Edit             F8=Image
F9=Shell            F10=Exit            Enter=Do
You have now changed the field to support jumbo frames.
Media speed
Most modern network switches and environments can take advantage of auto-negotiation to provide the best speed, especially as full-duplex network switches have become the standard. However, you force a particular configuration if the auto-negotiation fails to configure a speed that you know your network switch is capable of supporting.
The lsattr command gives you the information that you need. The en prefix displays your driver parameters, while the ent prefix displays your hardware parameters. Let's display your hardware parameters (see Listing 3).
Listing 3. Displaying the hardware parameters
testsys:/home/test>lsattr -El ent0
alt_addr       0x000000000000 Alternate Ethernet Address
Truechksum_offload yes        Checksum Offload Enable                    True
copy_buffs     32             Transmit Copy Buffers                      True
copy_bytes     65536          Transmit Copy Buffer Size                  True
desired_mapmem 0              I/O memory entitlement reserved for device False
max_buf_huge   64             Maximum Huge Buffers                       True
max_buf_large  64             Maximum Large Buffers                      True
max_buf_medium 256            Maximum Medium Buffers                     True
max_buf_small  2048           Maximum Small Buffers                      True
max_buf_tiny   2048           Maximum Tiny Buffers                       True
min_buf_huge   24             Minimum Huge Buffers                       True
min_buf_large  24             Minimum Large Buffers                      True
min_buf_medium 128            Minimum Medium Buffers                     True
min_buf_small  512            Minimum Small Buffers                      True
min_buf_tiny   512            Minimum Tiny Buffers                       True
trace_debug    no             Trace Debug Enable                         True
use_alt_addr   no             Enable Alternate Ethernet Address          True
In this case, your interface is set as auto-negotiate.
You should also check your firmware levels to make sure they are up to date. We've seen many network problems fixed when updating to the latest levels of firmware. The lscfg command gives you the firmware information (see Listing 4).
Listing 4. Using the lscfg command for firmware information
testsys:/home/test >lscfg -vp | grep -p ETHERNET
      4 X 1GB ETHERNET:        Record Name.................VINI
        Flag Field..................XXET
        Hardware Location Code......U78C0.001.DBJ3229-P2-C8
        Customer Card ID Number.....2BC4
        Serial Number...............YL10D9360034
        CCIN Extender...............1
        Product Specific.(VZ).......04
        FRU Number..................46K5965
        Part Number.................46K6484
        Product Specific.(HE).......0001
        Product Specific.(CT).......30910008
        Product Specific.(HW).......0001
        Product Specific.(B3).......000000000001
        Product Specific.(B4).......00
        Product Specific.(B7).......000000000000000000000000
        Product Specific.(B1).......00215EEB40C0002000215EEB40E00020
        Version.....................ipzSeries
      Physical Location: U78C0.001.DBJ3229-P2-C8

      4 X 1GB ETHERNET:
        Record Name.................VINI
        Flag Field..................XXET
        Hardware Location Code......U78C0.001.DBJ3226-P2-C8
        Customer Card ID Number.....2BC4
        Serial Number...............YL10D9360085
        CCIN Extender...............1
        Product Specific.(VZ).......04
        FRU Number..................46K5965
        Part Number.................46K6484
        Product Specific.(HE).......0001
        Product Specific.(CT).......30910008
        Product Specific.(HW).......0001
        Product Specific.(B3).......000000000001
        Product Specific.(B4).......00
        Product Specific.(B7).......000000000000000000000000
        Product Specific.(B1).......00215EEB4680002000215EEB46A00020
        Version.....................ipzSeries
      Physical Location: U78C0.001.DBJ3226-P2-C8

      4 X 1GB ETHERNET:
        Record Name.................VINI
        Flag Field..................XXET
        Hardware Location Code......U78C0.001.DBJ3227-P2-C8
        Customer Card ID Number.....2BC4
        Serial Number...............YL10D9360028
        CCIN Extender...............1
        Product Specific.(VZ).......04
        FRU Number..................46K5965
        Part Number.................46K6484
        Product Specific.(HE).......0001
        Product Specific.(CT).......30910008
        Product Specific.(HW).......0001
        Product Specific.(B3).......000000000001
        Product Specific.(B4).......00
        Product Specific.(B7).......000000000000000000000000
        Product Specific.(B1).......00215EEB4140002000215EEB41600020
        Version.....................ipzSeries
      Physical Location: U78C0.001.DBJ3227-P2-C8
See the Related topics section at the end of the article for a link to the most current release information for your adapter.
Though the series focuses on tuning in subsequent parts, you might want to start to familiarize yourself with the memory management facility of network subsystems. What you need to know at this point is that it relates to data structures called mbufs. These are used to store kernel data for incoming and outbound traffic. The buffer sizes themselves can range from 32 to 16384 bytes. They are created by making allocation requests to the Virtual Memory Manager (VMM). In an SMP box, each memory pool is split evenly for every processor. The monitoring section below shows you how to view mbufs. An important concept to note is that processors cannot borrow from the memory pool outside of its own processor.
Two other concepts you should be familiar with are virtual Ethernet and shared Ethernet.
- Virtual Ethernet: Virtual Ethernet allows for inter-partition- and IP-based communications between logical partitions on the same frame. This is done by the use of a virtual I/O switch. The Ethernet adapters themselves are created and configured using the HMC. If you recall, you tried to change an adapter earlier that was configured with virtual Ethernet.
- Shared Ethernet: Shared Ethernet allows for the use of Virtual I/O servers (VIOs), where several host machines can actually share one physical network adapter. Typically, this is used in environments that do not require substantial network bandwidth.
While the scope of this series is not on virtualization, you should understand that if you are using virtualization, there might be other reasons for your bottleneck outside of what you are doing on your host machine. While virtualization is a wonderful thing, be careful not to share too many adapters from your VIO server, or you might pay a large network I/O penalty. Keep in mind as well that with workload partitions (WPAR), the network configuration of the host environment is used and shared by each partition; you cannot configure WPAR network performance individually. Using appropriate monitoring tools should inform you if you have a problem.
In addition, application performance can be affected fundamental services, such as domain name service (DNS) used to resolve hostnames and Internet addresses.
Monitoring
This section provides an overview of general network monitoring commands and specific AIX 7 tools available to you. Some of the tools allow you to troubleshoot a performance problem quickly while others capture data for historical trending and analysis.
Let's get back to the old standby, netstat, which displays overall network statistics. Probably one of the most common commands you type in is netstat -in (see Listing 5).
Listing 5. Using netstat with the -in option
l488pp065_pub[/tmp] > netstat -in
Name  Mtu   Network     Address            Ipkts Ierrs    Opkts Oerrs  Coll
en1   1500  link#2      66.da.93.d1.6b.18 70136750     0   336237     0     0
en1   1500  10.153      10.153.20.65      70136750     0   336237     0     0
en0   1500  link#3      66.da.93.d1.6b.17 202571785    0   79277      0     0
en0   1500  172.29.128  172.29.148.225    202571785    0   79277      0     0
lo0   16896 link#1                         778719      0   778718     0     0
lo0   16896 127         127.0.0.1          778719      0   778718     0     0
lo0   16896 ::1%1                          778719      0   778718     0     0
Here is what it means:
- Name: Interface name.
- MTU: Interface Maximum Transfer Unit size.
- Network: The actual network address that the interface connects to.
- Address: Mac and IP address.
- Ipkts: The total amount of packets received by the interface.
- Ierrs: The amount of errors reported back from the interface.
- Opkts: The amount of packets transmitted from the interface.
- Oerrs: The amount of error packets transmitted from the interface.
- Coll: The amount of collisions on the adapter. If you are using Ethernet, you won't see anything here.
Another handy netstat flag is the -m option. This flag allows you to view the Kernel malloc statistics; the mbuf memory requests, including the size of the buffers, the amount in use and the failures by CPU (see Listing 6).
Listing 6. netstat with -m option
l488pp065_pub[/tmp] > netstat -m
Kernel malloc statistics:

******* CPU 0 *******
By size           inuse     calls failed   delayed    free   hiwat   freed
64                  566   2015884      0         7     266    5240       0
128                5890   1830085      0       175     158    2620       0
256                5781    651987      0       295    2875    5240     500
512                8000 181192188      0       972      56    6550       0
1024               3165   1889042      0       792      35    2620       0
2048               1071   3387085      0       520      23    3930       0
4096               2056      2775      0        83       5    1310       0
8192                  6       260      0         3     163     327       0
16384               256       413      0        62       0     163       0
32768                55       274      0        23       4      81       0
65536               117       175      0        76       0      81       0
131072                4         5      0         0     102     204       0

******* CPU 1 *******
By size           inuse     calls failed   delayed    free   hiwat   freed
64                   46    226765      0         0     146    5240       0
128                  58    152657      0         2     134    2620       0
256                  51     70035      0         2     301    5240       0
512                  78  46458768      0         4      66    6550       0
1024                 62    171426      0        12      30    2620       0
2048                 23   3669503      0         5      25    3930       0
4096                  1       891      0         4       9    1310       0
8192                  1       567      0         3     306     327       0
16384                 0        12      0         5       2     163       0
32768                 2        17      0         3       7      81       0
65536                 0        11      0         6       0      81       0
131072                0         1      0         0      20      40       0

******* CPU 2 *******
By size           inuse     calls failed   delayed    free   hiwat   freed
64                   21      1295      0         1      43    5240       0
128                   9       781      0         0      23    2620       0
256                   9      1226      0         0      39    5240       0
512                  81  36991563      0        10      55    6550       0
1024                 27      1241      0        15      33    2620       0
2048                  5      3286      0         0      23    3930       0
4096                  0        52      0         1       5    1310       0
8192                  0         1      0         1       0     327       0
32768                 0         1      0         1       1      81       0
131072                0         0      0         0      16      32       0

******* CPU 3 *******
By size           inuse     calls failed   delayed    free   hiwat   freed
64                   42      1224      0         2      86    5240       0
128                  15      1195      0        13     401    2620       0
256                  12      2607      0        82    1316    5240       0
512                  83  36405229      0       222    1733    6550       0
1024                 32      1220      0        14      32    2620       0
2048                 23      4549      0       260     507    3930       0
4096                  1        42      0         3       3    1310       0
8192                  0        58      0         7      21     327       0
16384                 0       128      0        19     121     163       0
32768                 2        29      0         7      22      81       0
65536                 0        47      0        24      47      81       0
131072                0         0      0         0     102     204       0
The -m option is particularly useful because it shows the network performance statistics in relation to individual CPUs. When monitoring and managing the performance with LPAR and WPAR environments, the ability to correlate your CPU resources and the network resources can give you valuable information about the correct allocation and distribution of network resources.
For Ethernet, you can use the entstat command to display device-driver statistics. This provides a plethora of information (see Listing 7).
Listing 7. Using the entstat command to display device driver statistics
l488pp065_pub[/tmp] > entstat -d ent0
-------------------------------------------------------------
ETHERNET STATISTICS (ent0) :
Device Type: Virtual I/O Ethernet Adapter (l-lan)
Hardware Address: 66:da:93:d1:6b:17
Elapsed Time: 16 days 1 hours 48 minutes 7 seconds

Transmit Statistics:                          Receive Statistics:
--------------------                          -------------------
Packets: 79636                                Packets: 203054741
Bytes: 15868037                               Bytes: 30905882351
Interrupts: 0                                 Interrupts: 201058047
Transmit Errors: 0                            Receive Errors: 0
Packets Dropped: 0                            Packets Dropped: 0
                                              Bad Packets: 0
Max Packets on S/W Transmit Queue: 0
S/W Transmit Queue Overflow: 0
Current S/W+H/W Transmit Queue Length: 0

Broadcast Packets: 5                          Broadcast Packets: 203036730
Multicast Packets: 6171                       Multicast Packets: 215
No Carrier Sense: 0                           CRC Errors: 0
DMA Underrun: 0                               DMA Overrun: 0
Lost CTS Errors: 0                            Alignment Errors: 0
Max Collision Errors: 0                       No Resource Errors: 0
Late Collision Errors: 0                      Receive Collision Errors: 0
Deferred: 0                                   Packet Too Short Errors: 0
SQE Test: 0                                   Packet Too Long Errors: 0
Timeout Errors: 0                             Packets Discarded by Adapter: 0
Single Collision Count: 0                     Receiver Start Count: 0
Multiple Collision Count: 0
Current HW Transmit Queue Length: 0

General Statistics:
-------------------
No mbuf Errors: 0
Adapter Reset Count: 0
Adapter Data Rate: 20000
Driver Flags: Up Broadcast Running
        Simplex 64BitSupport ChecksumOffload
        DataRateSet

Virtual I/O Ethernet Adapter (l-lan) Specific Statistics:
---------------------------------------------------------
RQ Length: 4481
Trunk Adapter: False
Filter MCast Mode: False
Filters: 255
  Enabled: 1  Queued: 0  Overflow: 0
LAN State: Operational

Hypervisor Send Failures: 0
  Receiver Failures: 0
  Send Errors: 0
Hypervisor Receive Failures: 0

Invalid VLAN ID Packets: 0

ILLAN Attributes: 0000000000003002 [0000000000003002]

Port VLAN ID:     2
VLAN Tag IDs:  None

Switch ID: ETHERNET0

Hypervisor Information
  Virtual Memory
    Total (KB)                 79
  I/O Memory
    VRM Minimum (KB)          100
    VRM Desired (KB)          100
    DMA Max Min (KB)          128

Transmit Information
  Transmit Buffers
    Buffer Size             65536
    Buffers                    32
    History
      No Buffers                0
  Virtual Memory
Collisions are largely a thing of the past with modern network switches, but look for transmit errors and make sure they are not increasing too fast. You need to learn to troubleshoot collision and error problems before you even begin to think about tuning. Alternatively, you can use netstat -v, which provides similar information.
Let's look at netpmon. netpmon provides information on CPU usage as it relates to the network, and it also includes data about the network device driver I/O, Internet socket calls, and other various statistics. Similar to its other trace brethren, tprof and filemon, it starts a trace and runs in the background until you stop it with the trcstop command. We like netpmon because it really gives you a detailed overview of network activity and also captures data for trending and analysis (though it is not as useful as nmon for this purpose). Here you'll use a trace buffer size of two million bytes (see Listing 8).
Listing 8. netpmom with -T option
l488pp065_pub[/tmp] > netpmon -T 2000000 -o /tmp/net.out
Run trcstop command to signal end of trace.
Sun Aug 15 04:58:06 2010
System: AIX 7.1 Node: l488pp065_pub Machine: 00F604884C00
Now you'll stop it (see Listing 9).
Listing 9. Stopping netpmom
l488pp065_pub[/tmp] > trcstop[netpmon: Reporting started]
23675650 Missed Entries found

[netpmon: Reporting completed]
[               4 traced cpus               ]
[         0.091 secs total preempt time   ]

[netpmon: 43.388 secs in measured interval]
Let's look at the data. Here is just a small sampling of the output (see Listing 10).
Listing 10. Sample output
Sun Aug 15 04:58:06 2010System: AIX 7.1 Node: l488pp065_pub Machine: 00F604884C00

========================================================================

Process CPU Usage Statistics:
-----------------------------
                                                   Network
Process (top 20)             PID  CPU Time   CPU %   CPU %
----------------------------------------------------------
netpmon                 12976354   41.7559  24.072   0.000
netpmon                 14155800   32.1352  18.526   0.000
inetd                   14155804   29.3093  16.897   0.000
xmtopas                 14155834   29.2385  16.856   0.000
xmtopas                 14155830   29.2381  16.856   0.000
xmtopas                 14155822   28.9899  16.713   0.000
xmtopas                 14155816   28.9433  16.686   0.000
xmtopas                 14155826   28.9390  16.683   0.000
xmtopas                 14155828   28.9308  16.679   0.000
inetd                   14155824   28.9287  16.677   0.000
xmtopas                 14155820   28.9227  16.674   0.000
xmtopas                 14155814   28.9158  16.670   0.000
inetd                   14155866   23.7606  13.698   0.000
inetd                   14155864   23.7131  13.671   0.000
xmtopas                 14155846   19.0223  10.966   0.000
inetd                   14155848   19.0083  10.958   0.000
inetd                    9371742   18.8547  10.870   0.000
inetd                    9371658   16.5665   9.551   0.000
inetd                    9371886   16.4571   9.488   0.000
xmtopas                  9371888   16.4094   9.460   0.000
----------------------------------------------------------
Total (all processes)             838.3315 483.300   0.000
Idle time                          78.8376  45.450

========================================================================

First Level Interrupt Handler CPU Usage Statistics:
---------------------------------------------------
                                                   Network
FLIH                              CPU Time   CPU %   CPU %
----------------------------------------------------------
data page fault                   255.0988 147.065   0.000
UNKNOWN                            17.9673  10.358   0.000
PPC decrementer                     2.7282   1.573   0.000
external device                     0.0081   0.005   0.000
instruction page fault              0.0002   0.000   0.000
queued interrupt                    0.0000   0.000   0.000
----------------------------------------------------------
Total (all FLIHs)                 275.8026 159.001   0.000

========================================================================

TCP Socket Call Statistics (by Process):
----------------------------------------
                                   ------ Read -----   ----- Write -----
Process (top 20)             PID   Calls/s   Bytes/s   Calls/s   Bytes/s
------------------------------------------------------------------------
sshd:                    5636334      0.12      1888      0.53        37
nonstop_aix              3539136      0.05         9      0.05         0
java                     4260046      0.05         9      0.05         0
------------------------------------------------------------------------
Total (all processes)                 0.21      1907      0.62        37

========================================================================

Detailed TCP Socket Call Statistics (by Process):
-------------------------------------------------

PROCESS: sshd:   PID: 5636334
reads:                  5
As you can see, there is little overall network I/O activity going on during this time. The top section is most important, as it really helps you get an understanding of what processes are consuming network I/O time, and you can use the more detailed per-process output to obtain more specific information. lsattr (used earlier to view the hardware parameters) is another command you will be using frequently to display statistics on your interfaces. The attributes that you see here are configured using either the chdev or no commands. Let's display your driver parameters (see Listing 11).
Listing 11. Displaying the driver parameters using lsattr
l488pp065_pub[/tmp] > lsattr -El en0alias4
IPv4                         Alias including Subnet Mask                True
alias6                       IPv6 Alias including Prefix Length         True
arp           on             Address Resolution Protocol (ARP)          True
authority                    Authorized Users                           True
broadcast                    Broadcast Address                          True
mtu           1500           Maximum IP Packet Size for This Device     True
netaddr       172.29.148.225 Internet Address                           True
netaddr6                     IPv6 Internet Address                      True
netmask       255.255.192.0  Subnet Mask                                True
prefixlen                    Prefix Length for IPv6 Internet Address    True
remmtu        576            Maximum IP Packet Size for REMOTE Networks True
rfc1323                      Enable/Disable TCP RFC 1323 Window Scaling True
security      none           Security Level                             True
state         up             Current Interface Status                   True
tcp_mssdflt                  Set TCP Maximum Segment Size               True
tcp_nodelay                  Enable/Disable TCP_NODELAY Option          True
tcp_recvspace                Set Socket Buffer Space for Receiving      True
tcp_sendspace                Set Socket Buffer Space for Sending        True
Finally, let's look at Figure 2.
Figure 2. nmon statistics
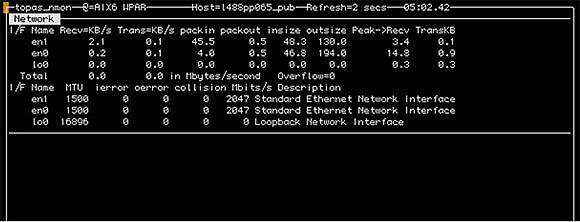
If you've been following the other series on AIX 7 (see Related topics), you know we love nmon and you should also, once you start using it. With nmon (type in n after startup), you have a quick snapshot of everything going on in your network, including adapter details, MTU, error counters and collisions, and megabit rating.
Further, you also have the ability to capture data with nmon. Using the nmon analyzer, you can print out graphical reports directly from Microsoft® Excel spreadsheets. See Related topics for a link to an IBM Wiki for the nmon manual or for downloads.
Summary
This article covered the relative importance of the network I/O subsystem, and defined the AIX 7 network I/O layers and how it relates to the OSI Model. You learned some best practices for network configuration, changed your Ethernet settings to support jumbo frame, and viewed interface hardware and driver data. You even examined the monitoring tools available to you and captured data using netpmon and nmon. In the next part of the series, you'll tune NFS, find out more about monitoring utilities, such as nfsstat and nmon, and discover how to tune with nfso.