Article
Build reusable Bob skills for developer workflow automation
Learn how to design, implement, optimize, and maintain Bob skills that automate data analysis, dashboard generation, and other repeatable developer workflowsAs AI agents become more capable, the challenge is not just writing code. The challenge is defining workflows that agents can execute reliably. Many developer tasks follow a consistent process: collecting inputs, applying domain knowledge, choosing the correct tools, validating results, and presenting outputs. Although each step may be simple, repeating the same process across multiple projects can become time-consuming and difficult to manage.
During my internship at IBM Research, I worked on analyzing IBM Granite benchmark results. The evaluation process required reviewing benchmark reports, interpreting evaluation metrics, identifying failure patterns, and creating visualizations to understand the results. Instead of performing these steps manually or repeating the same instructions in every prompt, I used IBM Bob to complete the entire workflow from a single natural language request.
In this article, you will learn how to design and build reusable Bob skills that automate complex developer workflows. The article uses an evaluation dashboard generation skill as the main example. You will learn how to:
- Identify workflows that are good candidates for Bob skills.
- Structure a Bob skill with clear invocation rules, inputs, workflow steps, and outputs.
- Organize supporting code into reusable and maintainable components.
- Design Bob skills that support multiple tools or output formats.
- Improve skill behavior through validation and iteration.
- Optimize Bob skills for maintainability and efficient token use.
The article also explains key architecture decisions, project organization strategies, and practical techniques for building Bob skills. You can apply these techniques to dashboard generation and other developer workflows.
Step 1. Identify a repetitive workflow
The first step in building a Bob skill is identifying a workflow that is repeated often enough to benefit from automation. In this project, each benchmark evaluation followed the same sequence of tasks:
- Read benchmark evaluation reports from comma-separated values (CSV) and JSON files.
- Analyze evaluation metrics and identify failed test cases.
- Classify failure patterns and identify likely root causes.
- Present findings through interactive visualizations and recommendations.
The evaluation dashboard skill automates this workflow. It converts benchmark reports into an interactive dashboard from a single natural language request. The same approach can be used to automate many other developer workflows.
After identifying a workflow, the next question is: Why use agent skills? Why not use alternatives such as fine-tuning, retrieval-augmented generation (RAG), or prompt engineering? Each approach has strengths and trade-offs.
Fine-tuning: Trains a model on new data to change its behavior. This approach can be effective, but it often requires significant time, cost, and maintenance. Updating the model as requirements change can also be difficult.
Retrieval-Augmented Generation (RAG): Retrieves relevant documents and adds them to the model context. This approach works well for information retrieval and question answering. However, dashboard generation requires additional tasks such as metric analysis, chart selection, dashboard design, and code generation.
Prompt Engineering: Places workflow instructions directly in prompts. This approach is simple and effective for small tasks. For complex workflows, prompts often become long, repetitive, and difficult to maintain.
One of the most powerful aspects of agent skills is that they are loaded lazily, making specialized instructions, domain knowledge, and workflows available exactly when needed. This keeps the agent's context focused and avoids unnecessary loading of context.
Skills also improve token efficiency. Instead of relying on large prompts, a skill can use scripts, tools, and structured workflows to complete tasks. For example, a dashboard generation skill can include chart selection rules, dashboard layout guidelines, and code generation logic. The agent can then generate consistent dashboards from a simple natural language request.
Now that you understand the benefits of agent skills, the next step is learning how agent skills work.
Step 2. Understand how Bob uses a skill
When a user asks Bob to generate a dashboard for IBM Granite evaluation metrics, Bob does not start by writing code. Bob first decides which skill can complete the task.
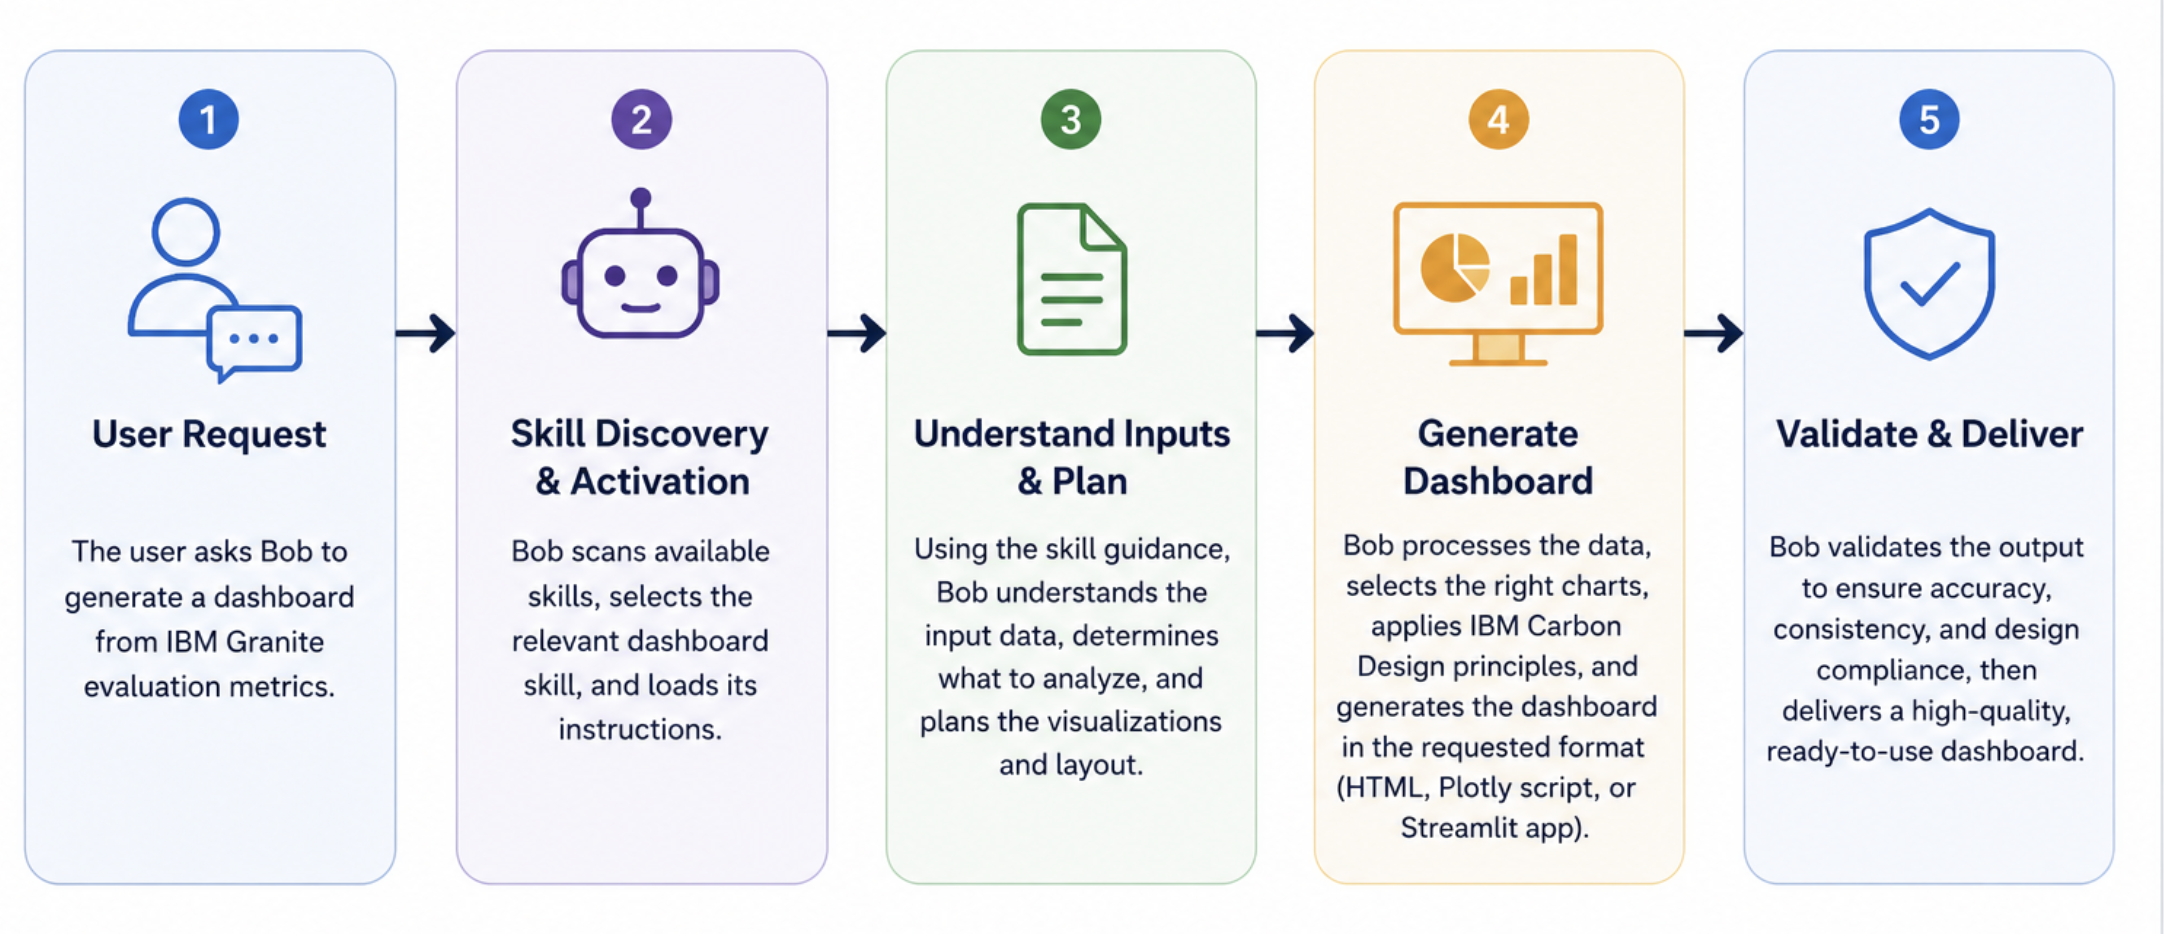
Discover the skill: Bob scans the metadata for available skills. Bob reads the skill names and descriptions. When Bob finds the
visualize-error-distributionskill, Bob recognizes that the skill matches the dashboard generation request.Load the skill instructions: After Bob selects the skill, Bob loads the complete
SKILL.mdfile. The file contains the instructions Bob needs to complete the task, including:- Expected CSV input files
- Visualization selection rules
- IBM Carbon design guidelines
- Validation checks
- Dashboard generation workflow
Understand the input: Bob reviews the benchmark reports provided by the user. Bob identifies the available evaluation metrics and decides how to visualize each metric.
Generate the dashboard: Bob follows the instructions in the skill to generate the dashboard. Bob reads the evaluation metrics, analyzes the data, selects appropriate charts, applies IBM Carbon design guidelines, and builds the dashboard. Based on the user's request, Bob can generate:
- A standalone HTML dashboard
- A Plotly-based Python application
- A Streamlit application
Validate the dashboard: Before returning the result, Bob checks that the dashboard meets the validation requirements defined in the skill. These checks help ensure that the dashboard is accurate, complete, and consistent. The user only specifies what they want, such as a dashboard from evaluation metrics. The skill defines how Bob completes the task.
Step 3. Define the skill structure
To build the visualization skill, I followed skill creation best practices. The goal was to keep the skill concise, reduce token use, and organize the instructions as a clear workflow with validation steps and output requirements.
The skill uses the following structure:
---
name: visualize-error-distribution
description: Generate interactive visualizations from agent benchmark reports.
---
## Invocation Heuristic
Defines when the skill should be activated.
## Format Selection
Prompts the user to choose between HTML, Streamlit, Plotly, or all output formats.
## Input Data
Specifies the expected benchmark CSVs and required columns.
## Visualization Rules
Defines chart selection, IBM Carbon Design guidelines, and validation checks.
## Execution Workflow
Outlines how the agent processes the benchmark data and generates dashboards.
## Output Formats
Supports standalone HTML, Streamlit applications, and Plotly-based Python scripts.
By organizing the skill into clear sections, Bob can identify when to use the skill, understand the required input data, and generate consistent Carbon-compliant dashboards with minimal user input.
Dashboard generation workflow
The visualization skill follows a structured workflow to convert benchmark reports into interactive dashboards. The following diagram shows the workflow used by the skill.
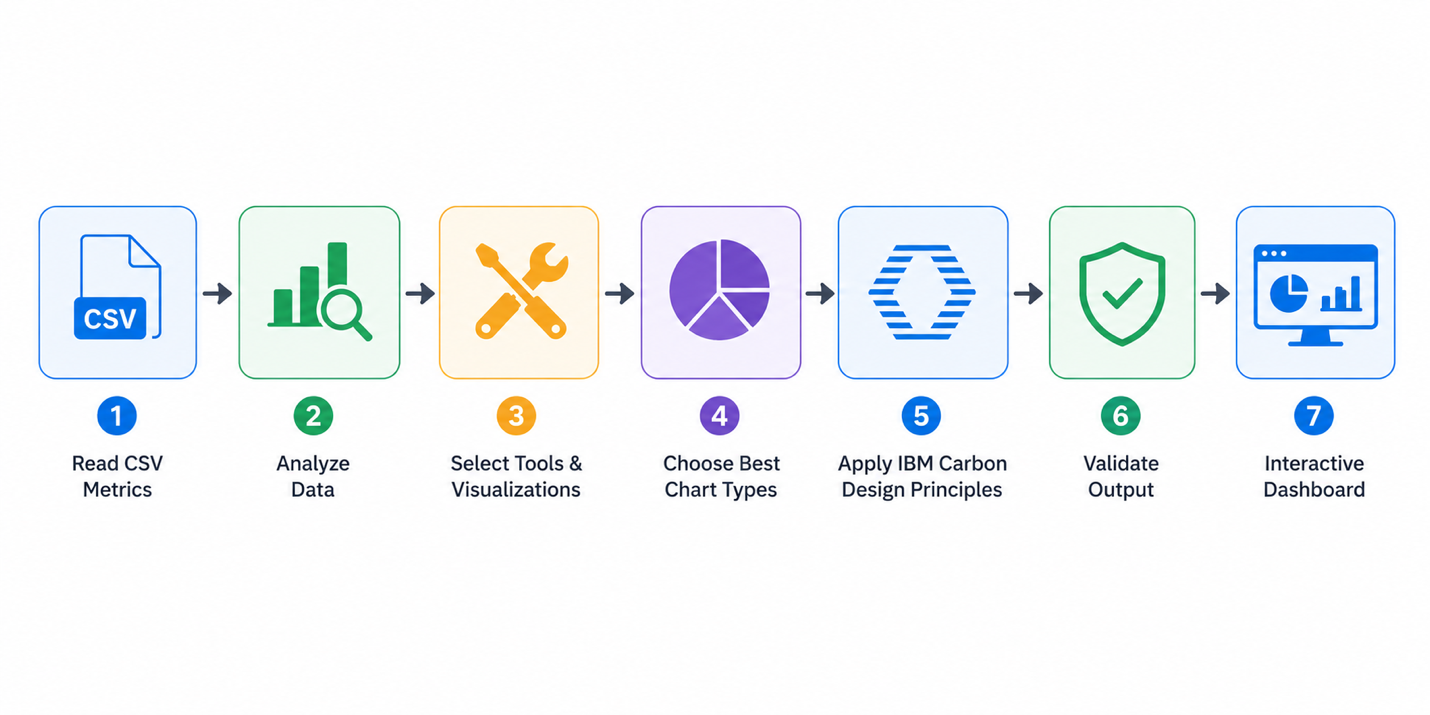
- Read benchmark reports.
- Analyze evaluation metrics.
- Select visualizations.
- Choose chart types.
- Apply IBM Carbon Design guidelines.
- Validate dashboard content and visualizations.
- Generate the final dashboard.
Step 4. Organize the skill implementation
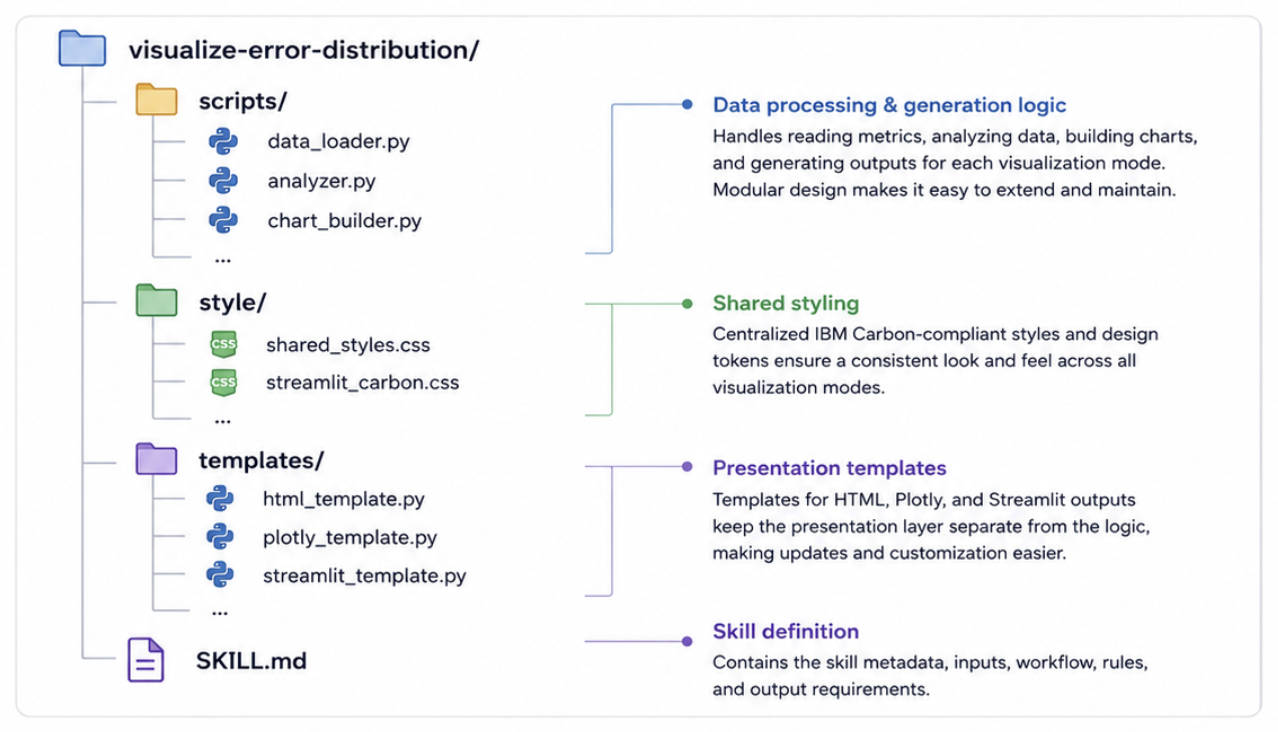
A clear project structure makes the Bob skill easier to extend and maintain. The project separates the implementation into four main components:
scripts/contains the data loading, data analysis, and dashboard generation logic.templates/stores reusable templates for HTML, Plotly, and Streamlit outputs.style/contains shared IBM Carbon styling.SKILL.mddefines the skill behavior, invocation rules, workflow steps, and output requirements.
This modular structure keeps business logic, presentation logic, and styling separate. The structure also makes it easier to add new visualization formats in the future.
Step 5. Support multiple output formats
Different developers use benchmark results in different ways. To support these use cases, the skill can generate three output formats:
HTML: Generates a standalone dashboard that users can open and share in a web browser.
Plotly: Generates a Python script that creates an interactive dashboard. This format works well with existing data analysis workflows and automation pipelines.
Streamlit: Generates an interactive web application that allows users to explore metrics, filter data, and investigate results.
Supporting multiple output formats allows developers to choose the format that best fits their workflow. The user experience remains the same regardless of the selected output format.
Dashboard examples
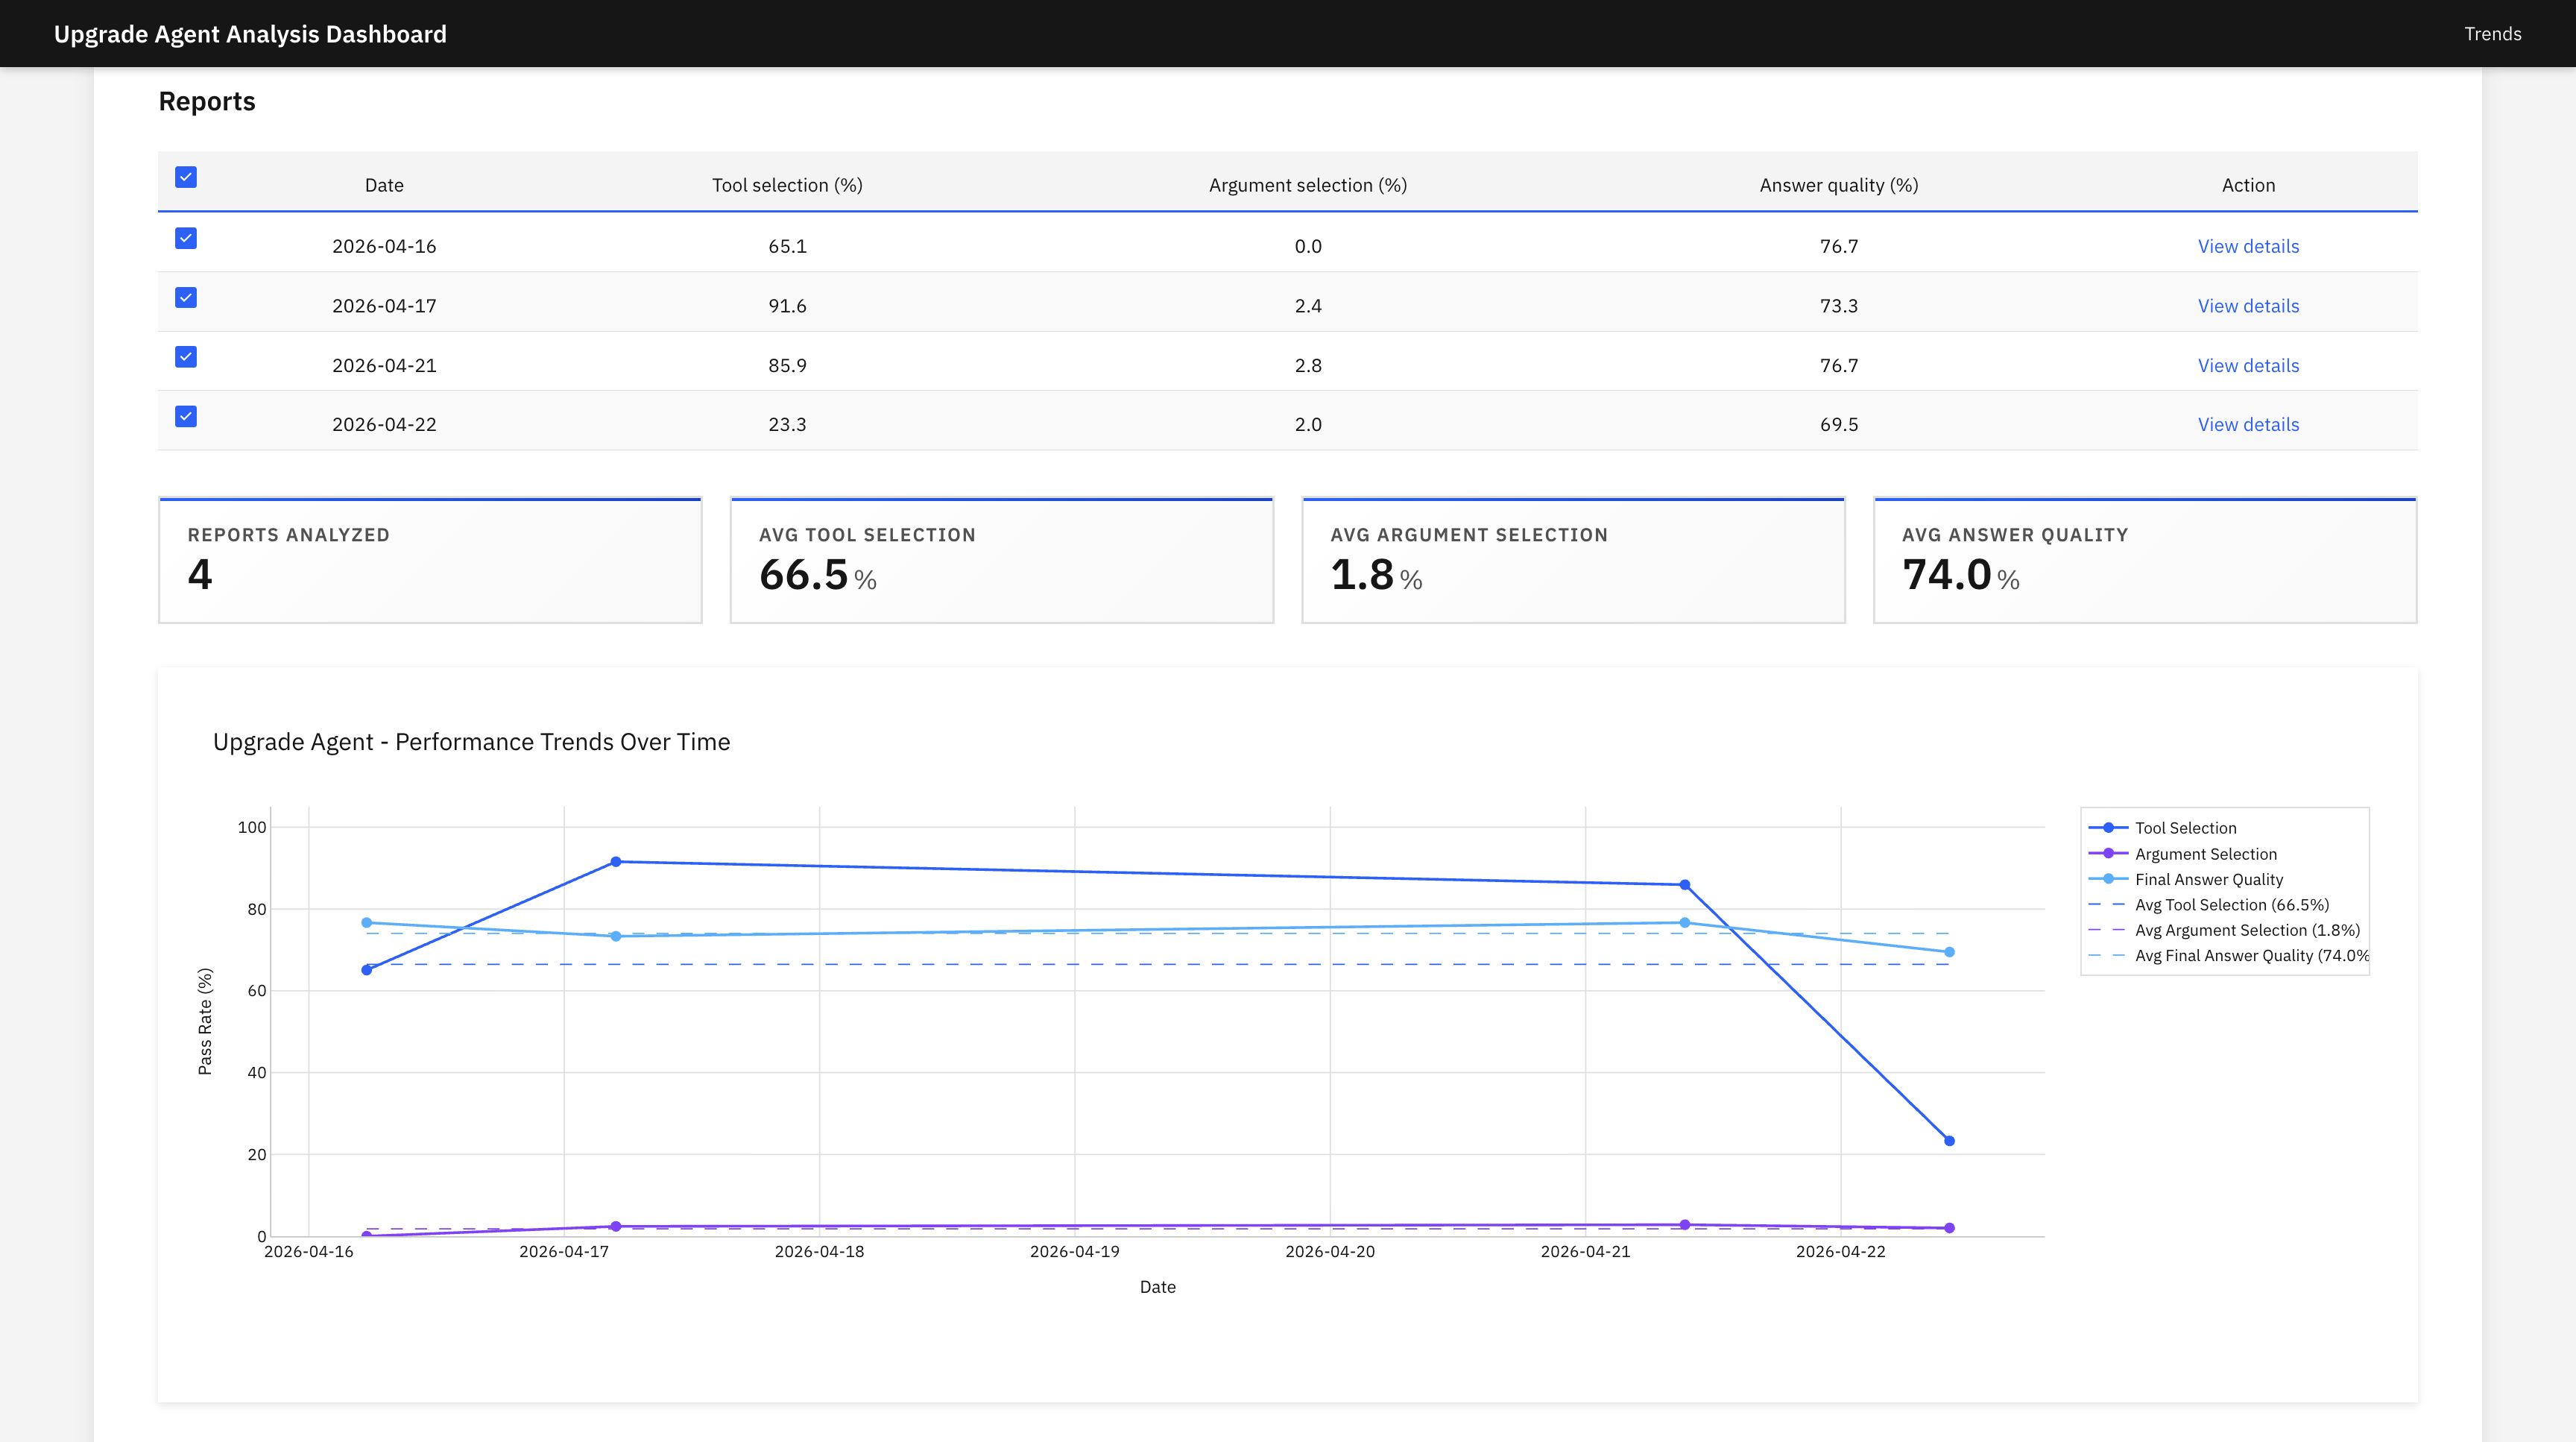
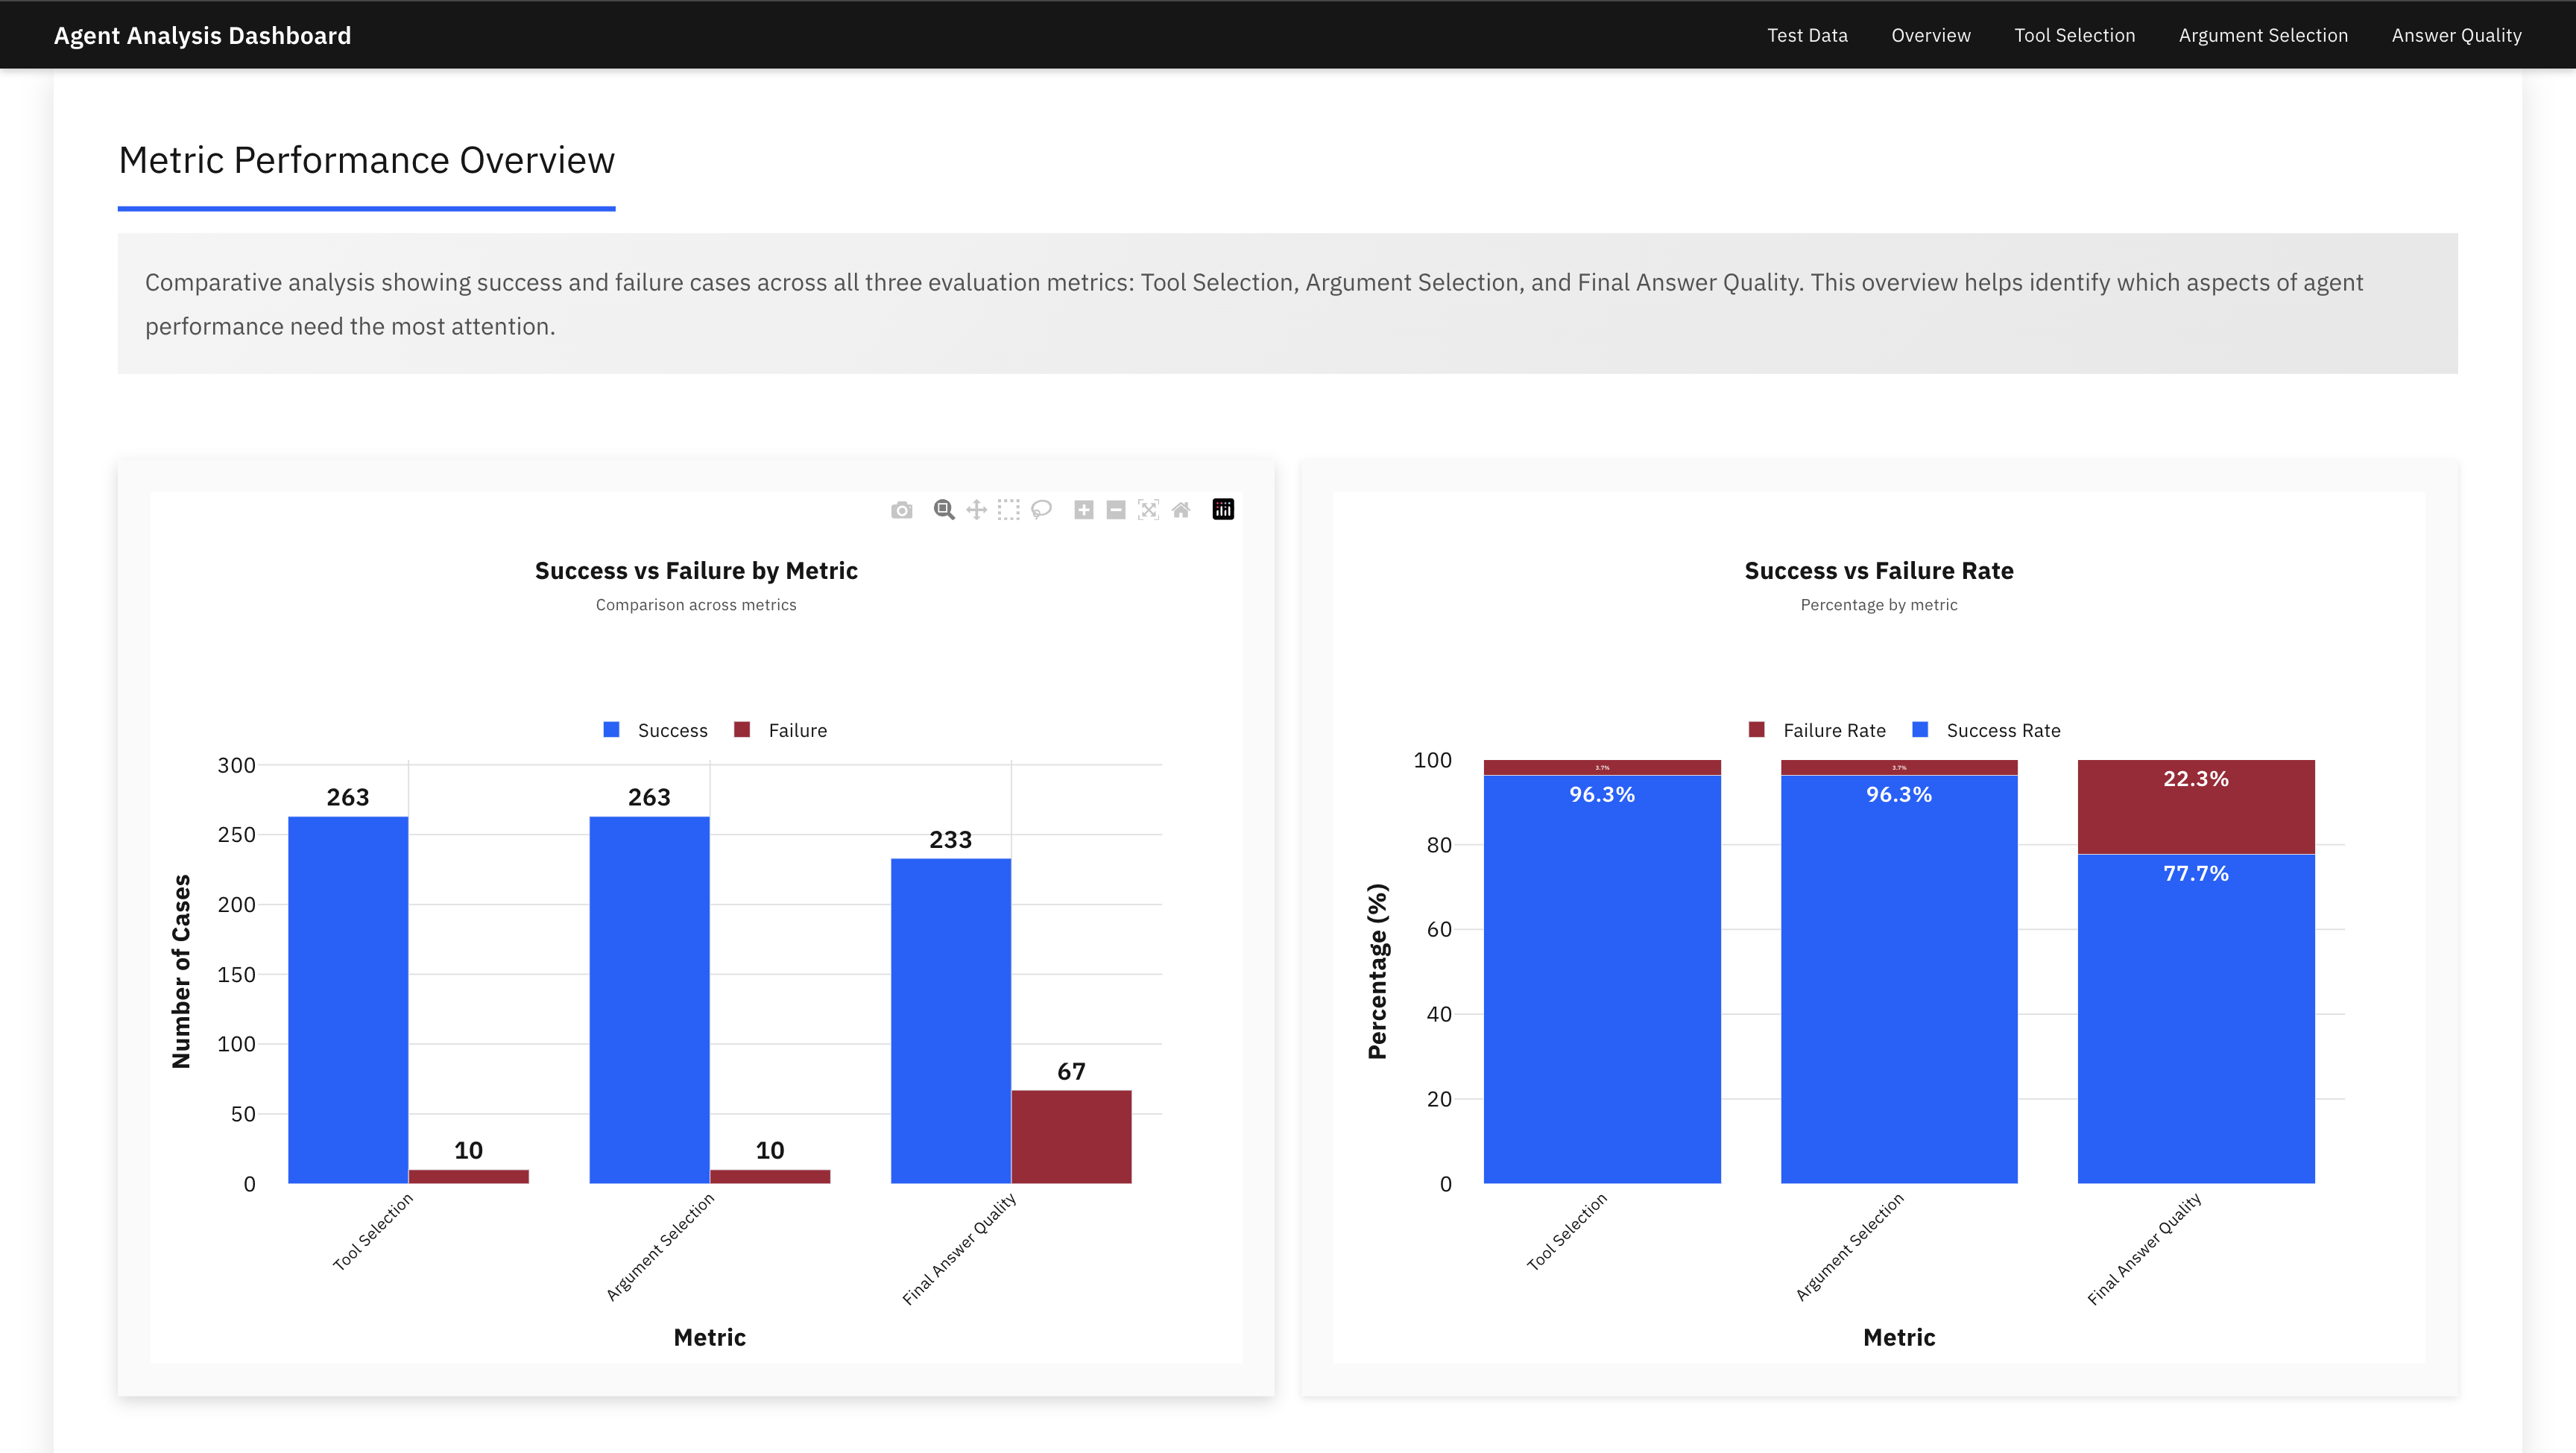
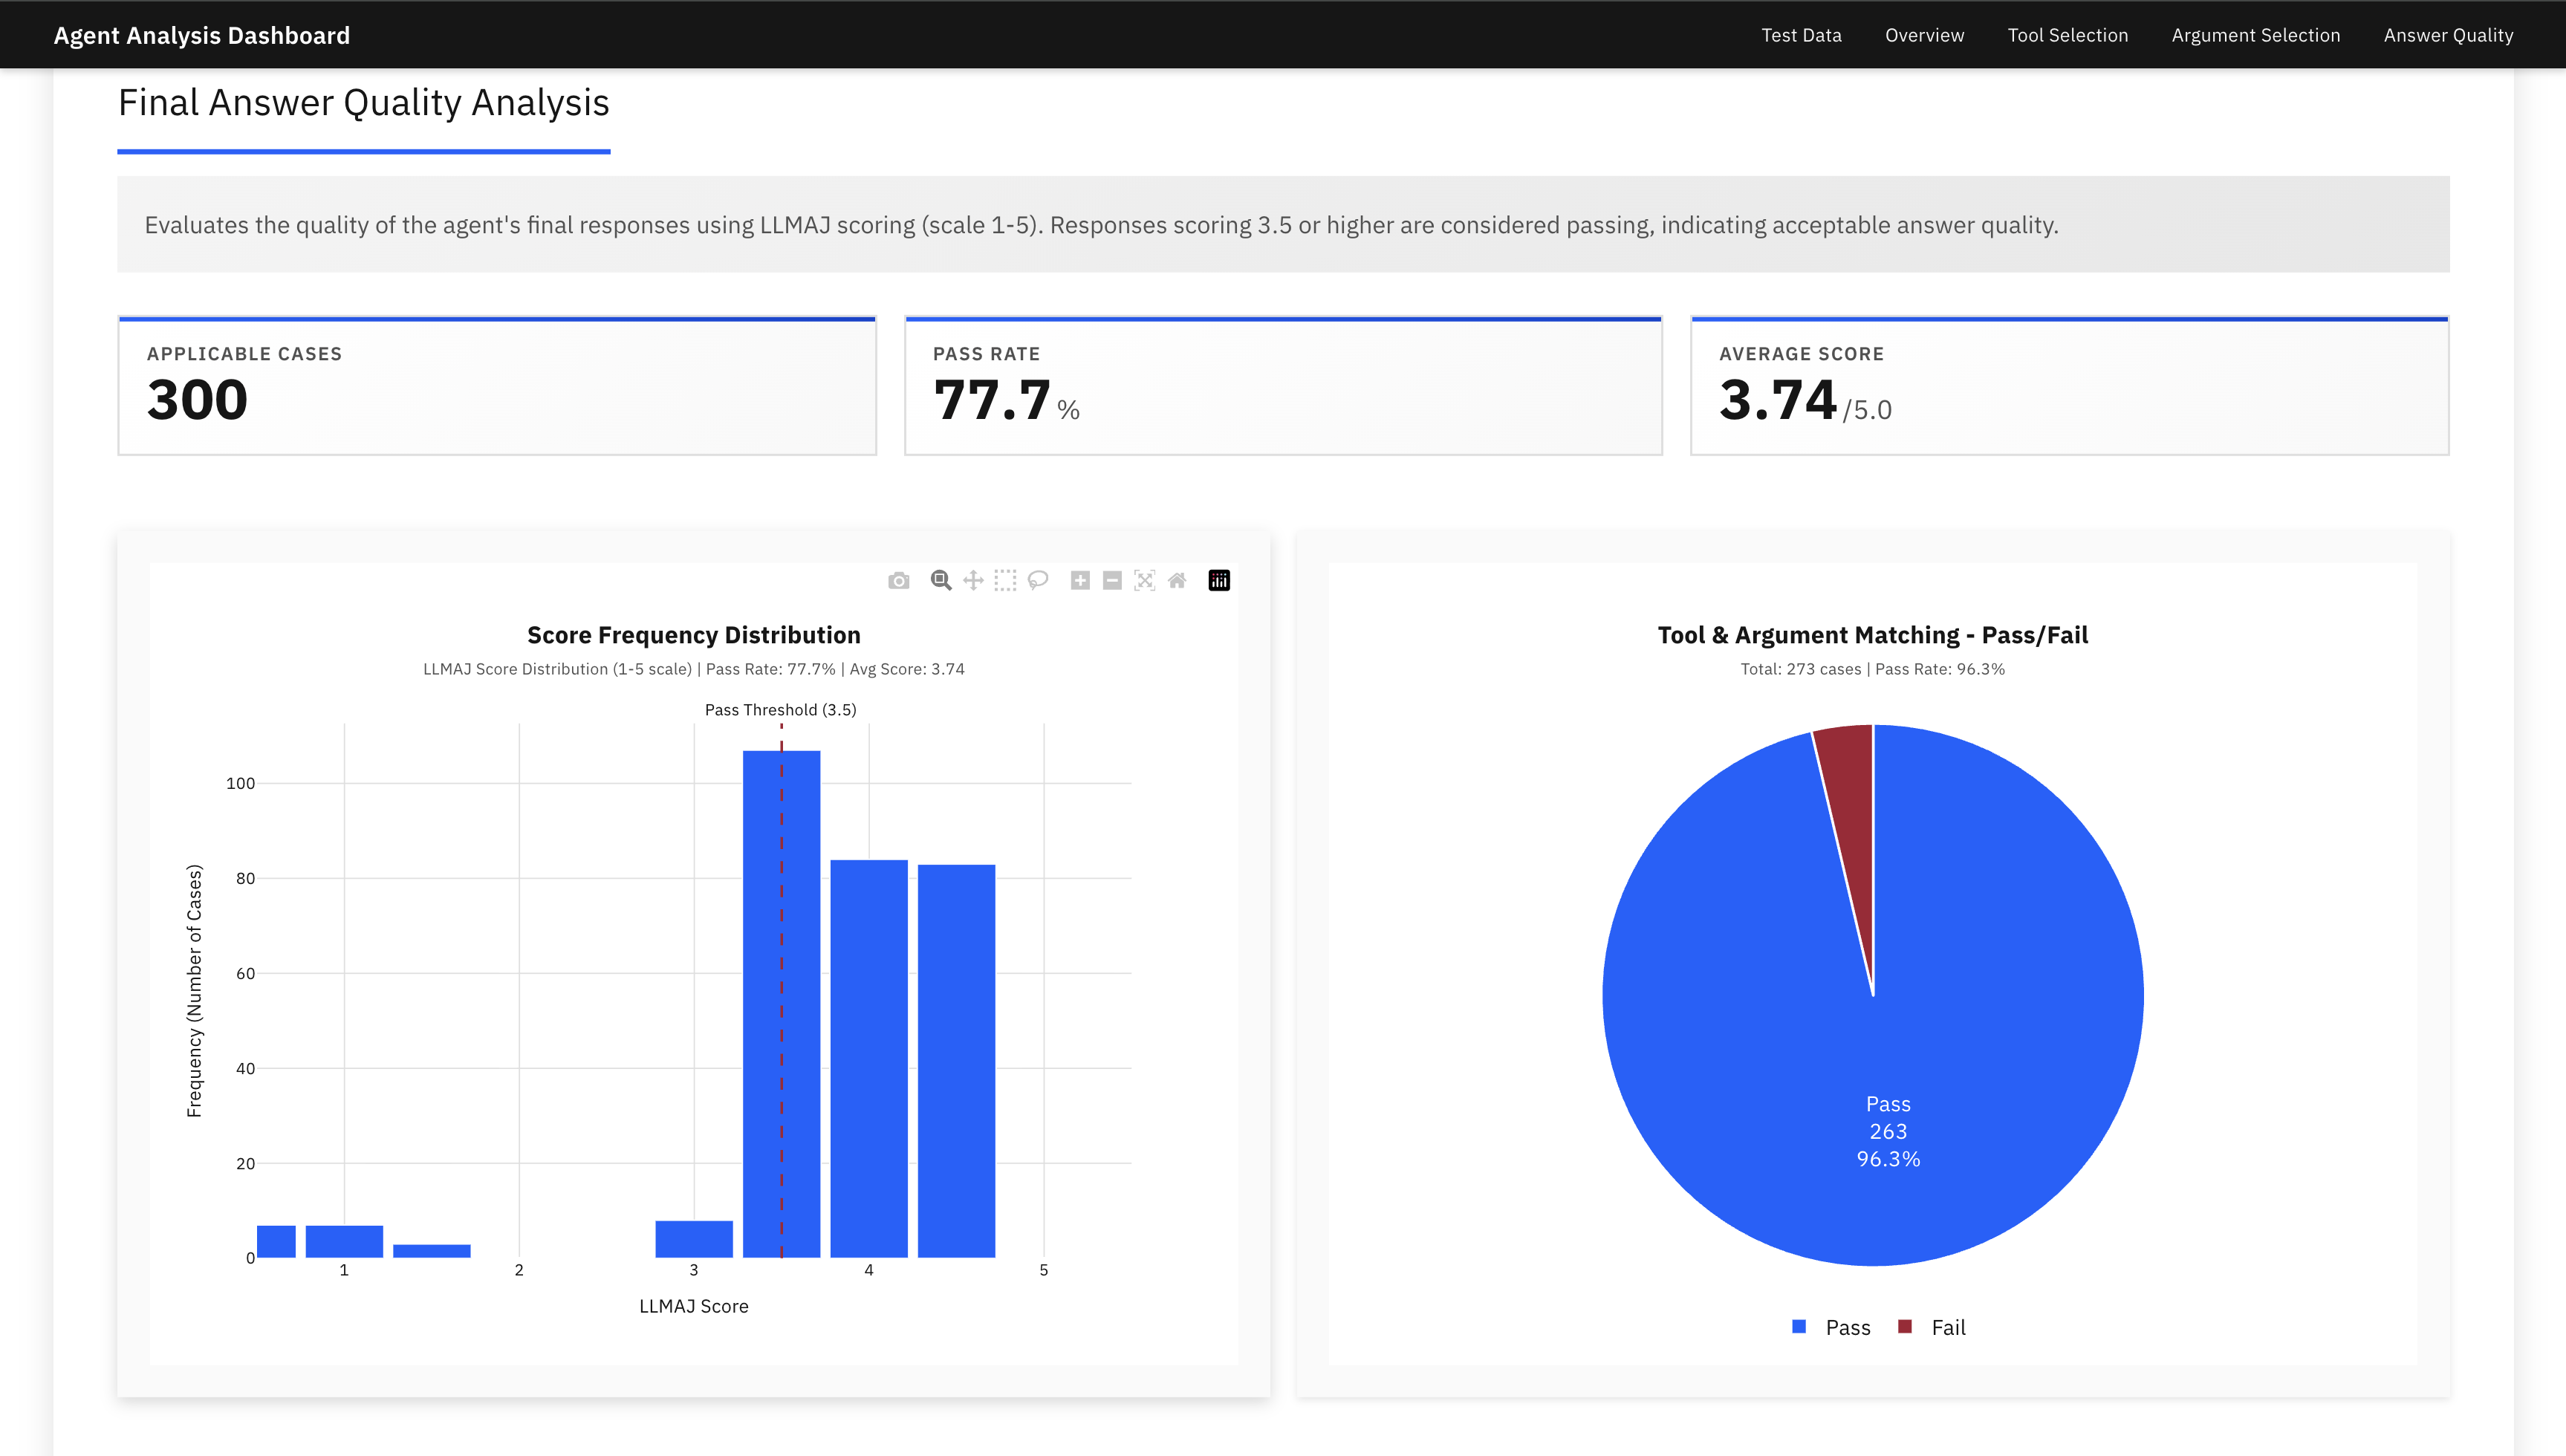
When the skill is invoked, Bob first asks the user which output format to generate: HTML, Plotly, Streamlit, or all formats. Based on the user's selection, Bob generates the requested dashboard.
Although each format uses a different implementation, the skill applies the same IBM Carbon Design guidelines to maintain a consistent user experience. The layout, visualizations, and reporting style remain consistent across all output formats, while the interaction model is adapted to the selected platform.
The following images show examples of dashboards generated by the skill.
Step 6. Optimize the skill
After the skill generates reliable outputs, the next step is skill optimization. Use the following process during development:
- Start with clear and detailed instructions.
- Remove repeated instructions.
- Combine similar guidance.
- Move predictable logic into Python scripts.
- Test the skill after each change.
AI can also help improve the skill. AI can identify long sections, suggest shorter text, and highlight instructions that the model may not need.
The goal is not to create the shortest possible skill. The goal is to keep the skill reliable while reducing unnecessary token use.
Lessons learned from building a Bob skill
Building the skill required several iterations. The following lessons helped improve skill reliability and reduce token usage.
Keep prompts concise: Token efficiency is important when building skills. Early versions of the skill used long instructions and many examples. These instructions increased context size and execution cost. A useful rule is: every token should have a clear purpose. If removing an instruction does not reduce output quality, the instruction probably does not need to be in the skill.
Move predictable logic into code: Move predictable logic into Python scripts whenever possible, including data processing, metric calculations, and dashboard generation logic. Remove repeated instructions and simplify the
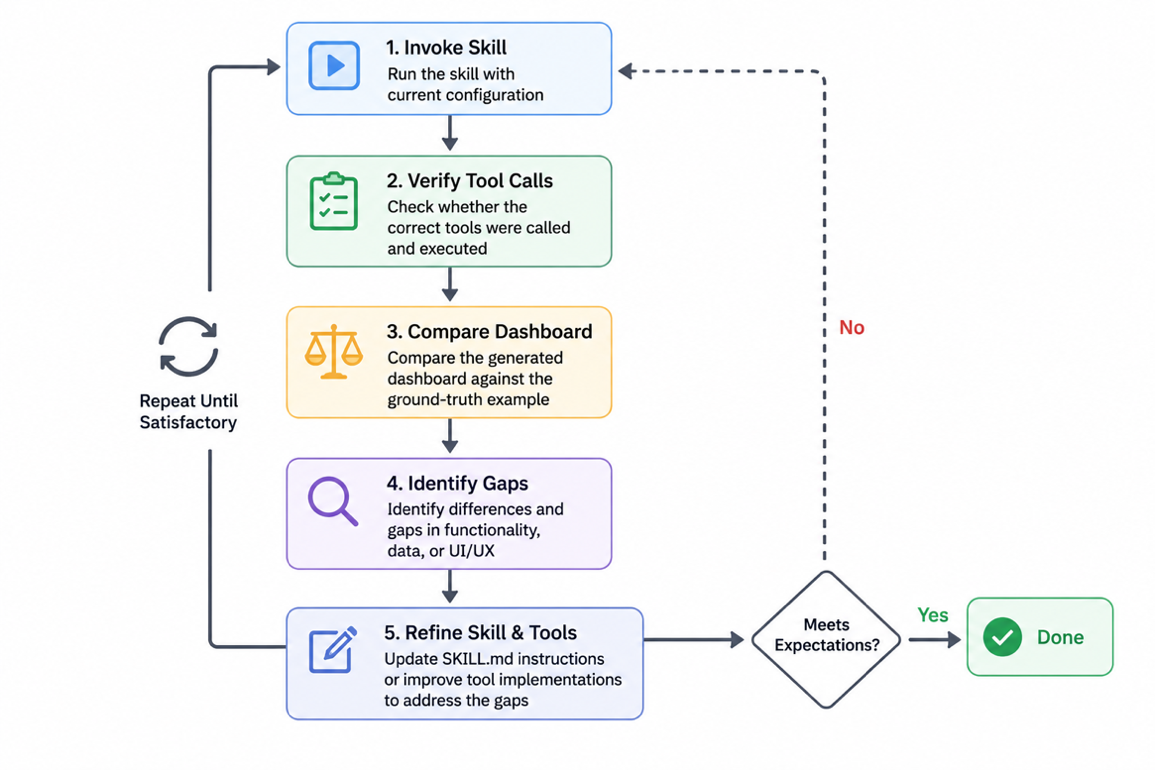
SKILL.mdfile. Many instructions are unnecessary because the model already understands common reasoning patterns. This approach makes the skill more concise, easier to maintain, and more efficient.Validate the skill through iteration: Dashboard quality improves through repeated testing. Use the following validation process as part of the prompt to Bob.
- Invoke the skill with sample benchmark reports.
- Check whether Bob used the correct tools.
- Compare the generated dashboard with a ground-truth example.
- Identify missing features or incorrect behavior.
- Update the
SKILL.mdfile or the supporting scripts. Test the skill again.
Repeat this process several times and review the dashboard after each change. This iterative process helps the skill generate consistent dashboards that match the expected design and functionality.
An interesting observation is that this improvement process could also be automated by another skill. For example, you could create a skill that evaluates, tests, and improves other skills.
Know when to write code yourself: AI can generate a large portion of the implementation, but human expertise is still valuable. The agent can complete most of the work, while you implement the remaining parts manually. Refine chart generation logic, improve responsive layouts, and fix edge cases to create a polished user experience. For detailed adjustments, manual coding is often faster and more cost-effective than repeatedly prompting the agent.
Use visual references: Visual references can significantly improve results. For user interface and styling tasks, Bob produces better outputs when you provide screenshots of both the target design and the current implementation. The screenshots help Bob understand the required changes and generate more accurate updates. Keeping relevant files open in the editor also helps Bob identify the correct context and make better suggestions.
Summary
Building this visualization skill showed that agent skills are more than a way to organize prompts. Agent skills provide a structured way to package workflows, domain knowledge, and implementation guidelines into reusable components.
After you build one well-designed skill, creating skills for other workflows becomes much easier. Instead of repeatedly explaining how a task should be completed, you can define the workflow once, package it as a skill, and let Bob execute it whenever the workflow is needed.