Tutorial
Analyze and modernize enterprise asset management workflow scripts
Analyze, classify, and optimize enterprise asset management workflow scripts to improve code quality, performance, security, and maintainabilityEnterprise asset management systems often collect hundreds or thousands of workflow scripts over many years. These scripts run business functions such as data validation, approval routing, escalation handling, system integration, and rule processing. Over time, the script set becomes hard to manage. Teams change, requirements shift, and technical debt grows. Technical consultants and implementation leads often take over large script collections with poor documentation, inconsistent code, and hidden performance or security risks.
In this tutorial, you build a code analyzer application, connect it to your asset management system, run analysis, and generate improved code. You group scripts by trigger type and business function, and find optimization opportunities by following a structured modernization process. You can use the application workflow, the IBM Bob workflow, or both.
Note: This tutorial applies to any asset management software. It is not limited to IBM Maximo Application Suite. Maximo is used only as an example.
Architecture of the Maximo script analyzer
The Maximo code analyzer uses a three-tier architecture for enterprise workflow script analysis.
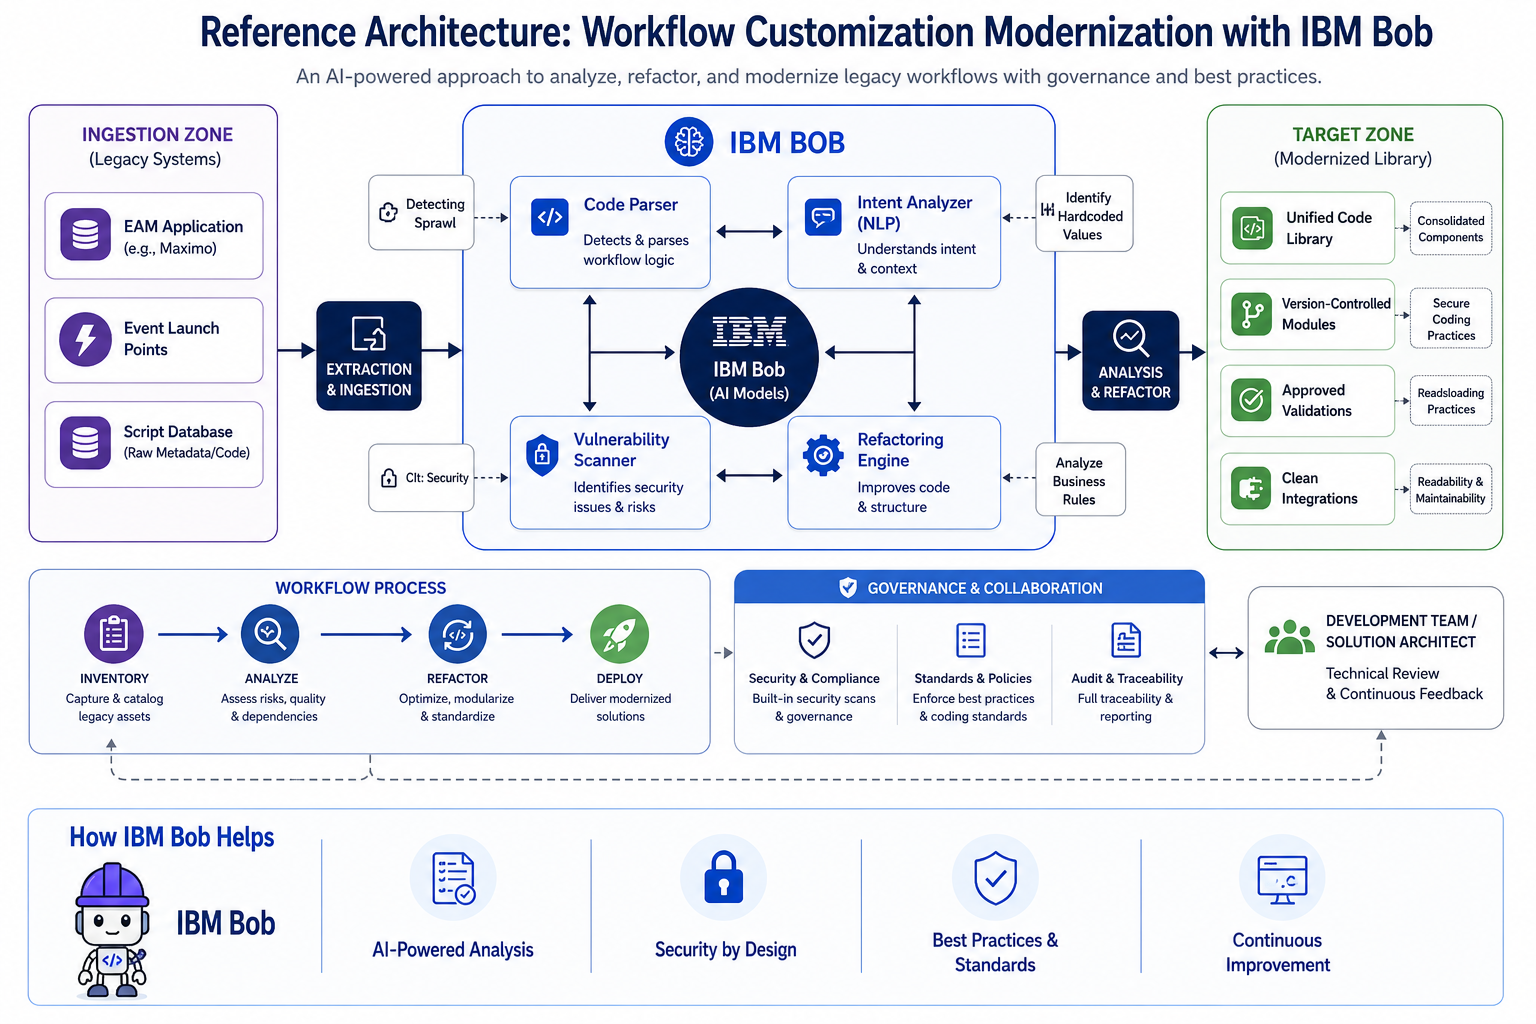
Data layer: The application connects to the asset management system REST API. It retrieves automation scripts, script metadata, and execution context data. It also collects launchpoint types (object, attribute, action, integration), variables, and script relationships to map the full execution flow.
Backend layer: A Node.js and Express.js application provides REST endpoints for script retrieval, analysis, and optimization. The analysis engine checks code quality across performance, security, maintainability, and coding standards. The impact analyzer measures business impact. It calculates metrics such as execution-time reduction, cost savings, and risk reduction.
Frontend layer: A React application with IBM Carbon Design System v11 provides the user interface. It supports system configuration, script browsing, analysis results, and impact review. The interface includes dashboards with metrics, code views with syntax highlighting and line numbers, and before-and-after comparisons with measured improvements.
AI integration: IBM Bob analyzes code, detects patterns, and suggests optimizations. Bob understands asset management scripting patterns. Bob identifies issues such as open database connections and SQL injection risks. Bob generates updated code that follows platform best practices.
Data flow:
- Enter API credentials in the UI to connect to the asset management system.
- The application retrieves scripts and metadata through the REST API.
- The backend processes and stores the scripts for analysis.
- The analysis engine checks each script for performance, security, maintainability, and coding standards.
- The impact analyzer calculates metrics such as execution time, cost savings, and risk scores.
- The frontend shows results in dashboards, code views, and comparison screens.
- The application generates updated code with detailed explanations for each change.
Prerequisites
Before you start, make sure that you have:
- Node.js version 25, or later installed.
- npm version 11, or later installed.
- IBM Bob installed. Sign up for a free IBM Bob trial.
- IBM Maximo Application Suite. Sign up for a free IBM Maximo Application Suite trial. Enable REST API access in your system. Create an API key or authentication token. For instructions, see Generating and managing API keys.
Basic knowledge
- JavaScript or Python
- REST APIs
- Asset management system scripting framework
Maximo script analysis approaches
This tutorial provides two ways to analyze and update asset management scripts. You can use one approach or both.
Application workflow: Use the code analyzer web application. Connect to your asset management system, view scripts, run analysis, and review results in a dashboard. This option supports team use, repeatable steps, and visual reports. Follow Step 1 to Step 10.
IBM Bob workflow: Use IBM Bob with the Maximo Script Optimizer mode. Fetch, analyze, and update scripts through a chat interface. Review issues, updated code, and reports without using the web application. This option supports quick analysis and testing of script improvements. Follow the Analyze and optimize Maximo scripts with IBM Bob section.
Step 1. Clone the repository
Clone the repository and navigate to the project directory.
git clone https://github.com/ibm-self-serve-assets/building-blocks
cd building-blocks/build-and-deploy/asset-management/assets/maximo_code_modernization_asset
The directory contains:
| Item | Description |
|---|---|
| backend/ | Node.js and Express.js server |
| frontend/ | React application with IBM Carbon Design System |
| .env.template | Environment variable template |
| README.md | Project documentation |
Step 2. Install dependencies
Install backend dependencies.
 cd backend
 npm install
Install frontend dependencies.
 cd ../frontend
 npm install
Copy the environment file and add your credentials.
 cd ..
 cp .env.example .env
Update the
.envfile with your configuration.# Backend server settings PORT=5000 NODE_ENV=development # Asset management system settings MAXIMO_BASE_URL=https://your-maximo-instance-url MAXIMO_API_ENDPOINT=/maximo/api/os/MXAPIAUTOSCRIPT?oslc.pageSize=1000&oslc.select=* MAXIMO_API_KEY=your-api-key-hereNote: The
.envfile is excluded from version control. Do not commit credentials.
Step 3. Run the application UI
Start the backend server.
 cd backend
 npm run dev
The backend server runs on
http://localhost:5000.Start the frontend application in a new terminal.
 cd frontend
 npm run dev
The frontend application runs on
http://localhost:3000.Note: The frontend uses port 3000 (see
vite.config.js). To change the port, update theserver.portsetting in the Vite configuration file.Open your browser and go to
http://localhost:3000. The Configuration tab opens.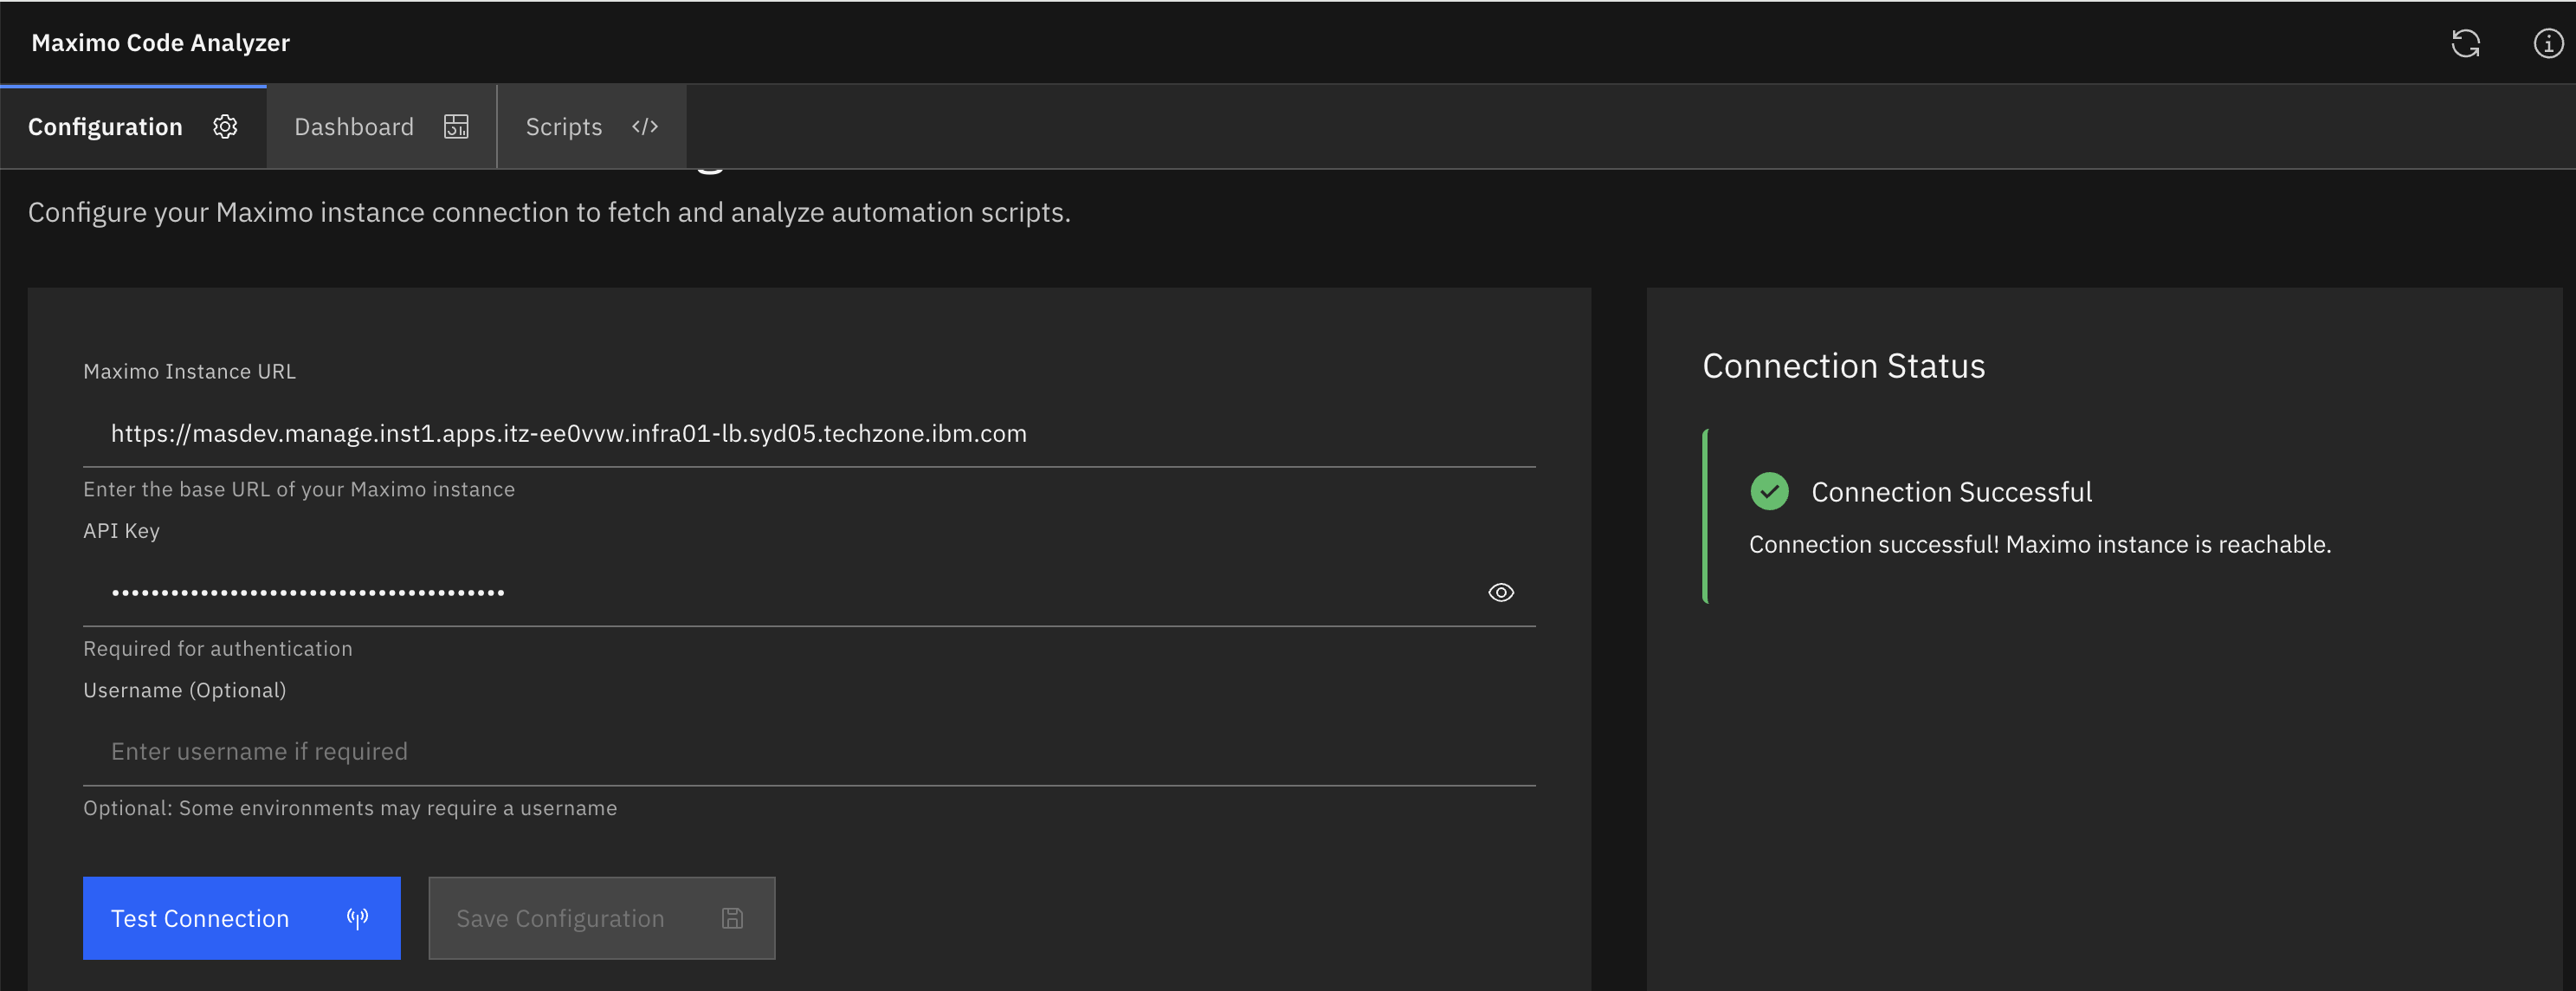
- Configure the system connection:
- System URL: Enter the base URL of your asset management system (for example,
https://your-instance.example.com). - API key: Enter your API key or authentication token.
- System URL: Enter the base URL of your asset management system (for example,
- Click Test Connection to verify access.
Click Save Configuration to store the settings in browser localStorage.
The test verifies:
Network access to the system.
- API authentication and authorization.
- REST API endpoint availability.
Script access permissions.
If the test fails, check:
The system URL is correct and reachable.
- The API key is valid and not expired.
- Network or firewall rules allow access.
- The API endpoint path matches your system version.
- Configure the system connection:
Step 4. View dashboard statistics
After you save the configuration, open the Dashboard tab. The dashboard shows script statistics and system metrics.
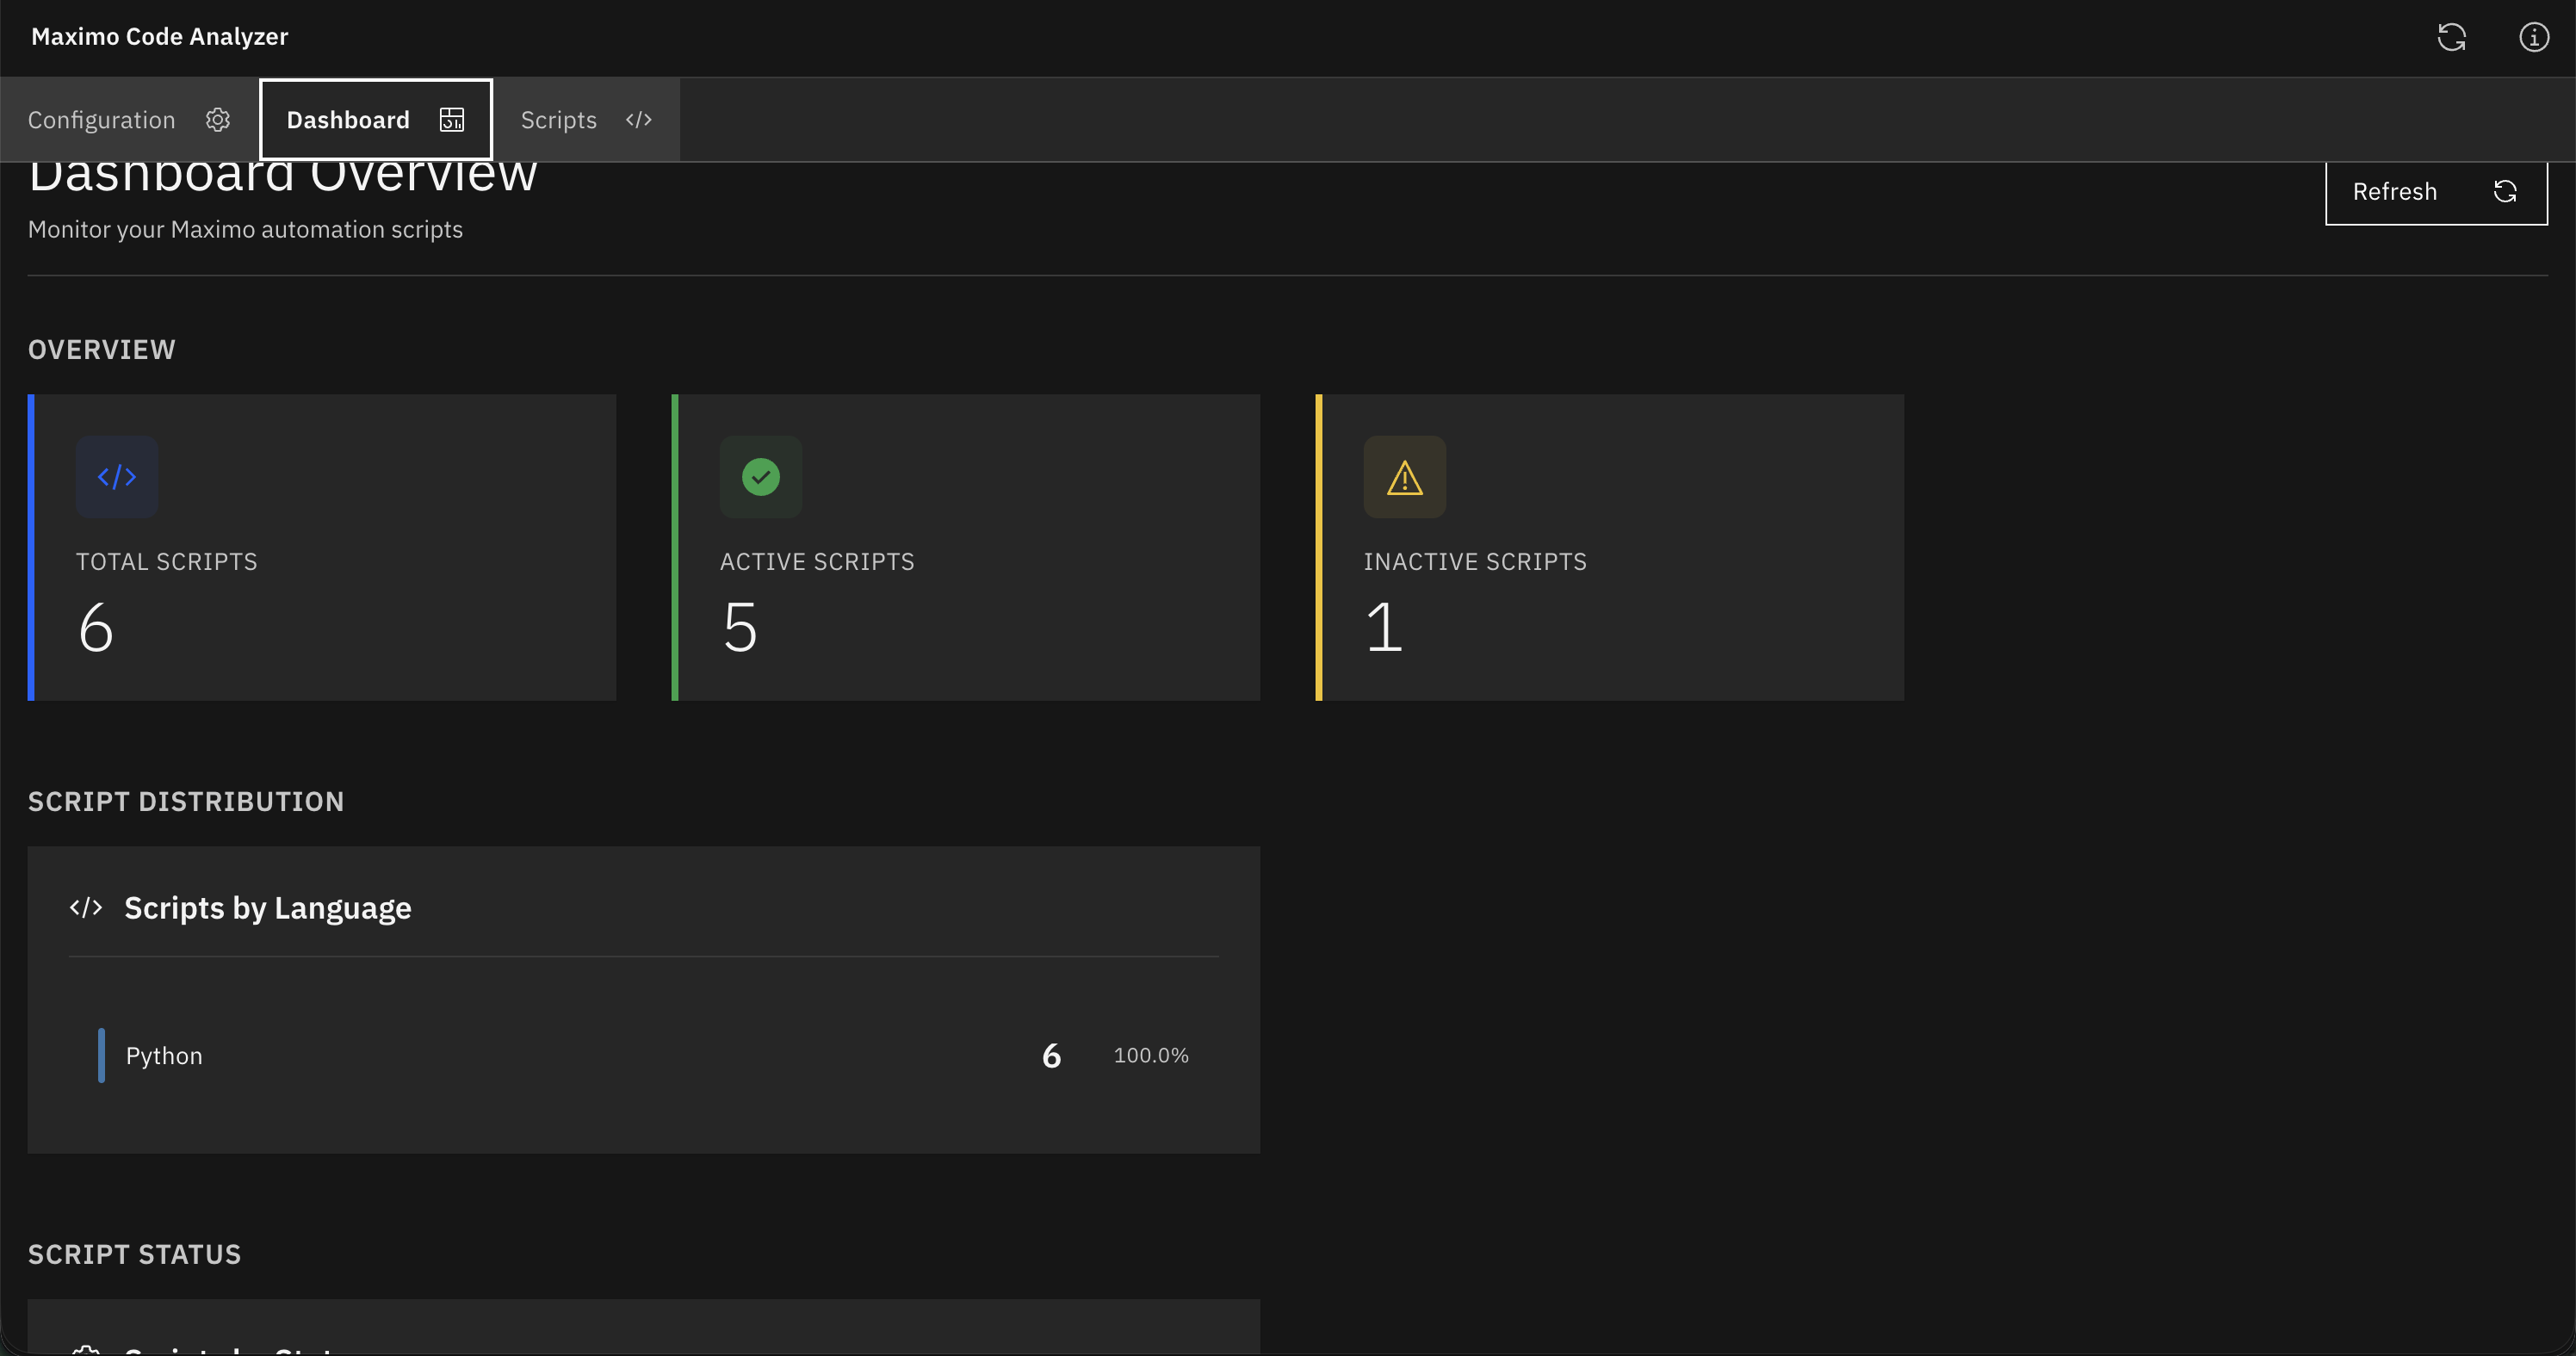
The dashboard shows key metrics in various sections:
Overview section:
- Total scripts: Total number of scripts across all launchpoint types.
- Active scripts: Number of enabled scripts in use.
- Inactive scripts: Number of disabled scripts.
Scripts by language:
- Count of scripts by language (Python, JavaScript, Java).
- Percentage share for each language.
Script status:
- Count of scripts by status (Draft, Active, Inactive).
- Breakdown of scripts by lifecycle stage.
The dashboard provides a view of your script inventory and system usage before detailed analysis.
Step 5. Browse and analyze scripts
Open the Scripts tab to view and review individual automation scripts.
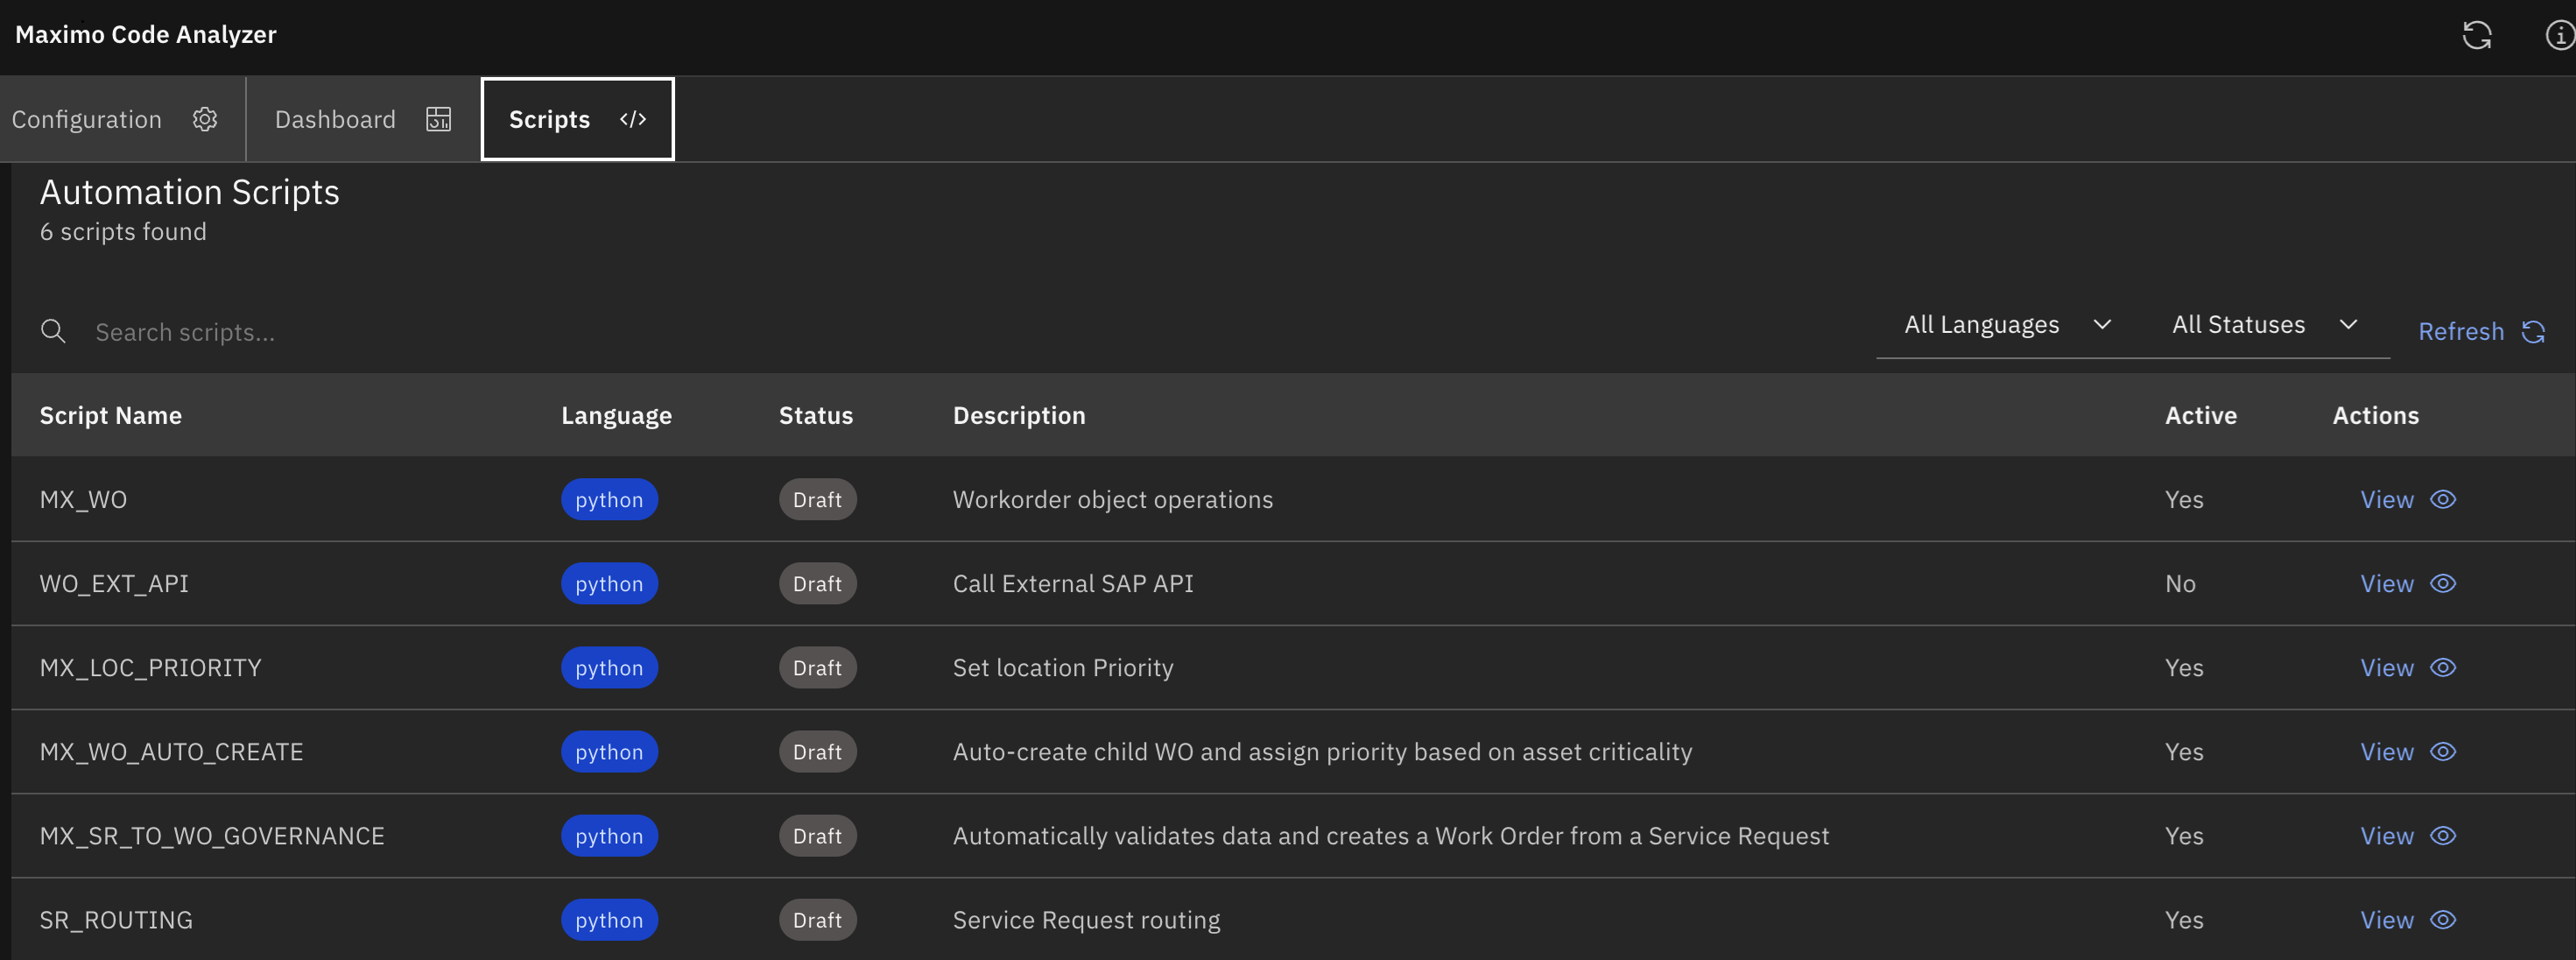
Scripts appear in a table with the following columns:
- Script name: Unique script identifier.
- Language: Programming language (Python, JavaScript, Java).
- Status: Deployment status (Draft, Active, Inactive).
- Description: Purpose of the script.
- Active: Current state (Yes or No).
- Actions: View option to open details.
Click the View icon (eye) for a script to open the detail window. The detail window includes the following tabs:
Script Info:
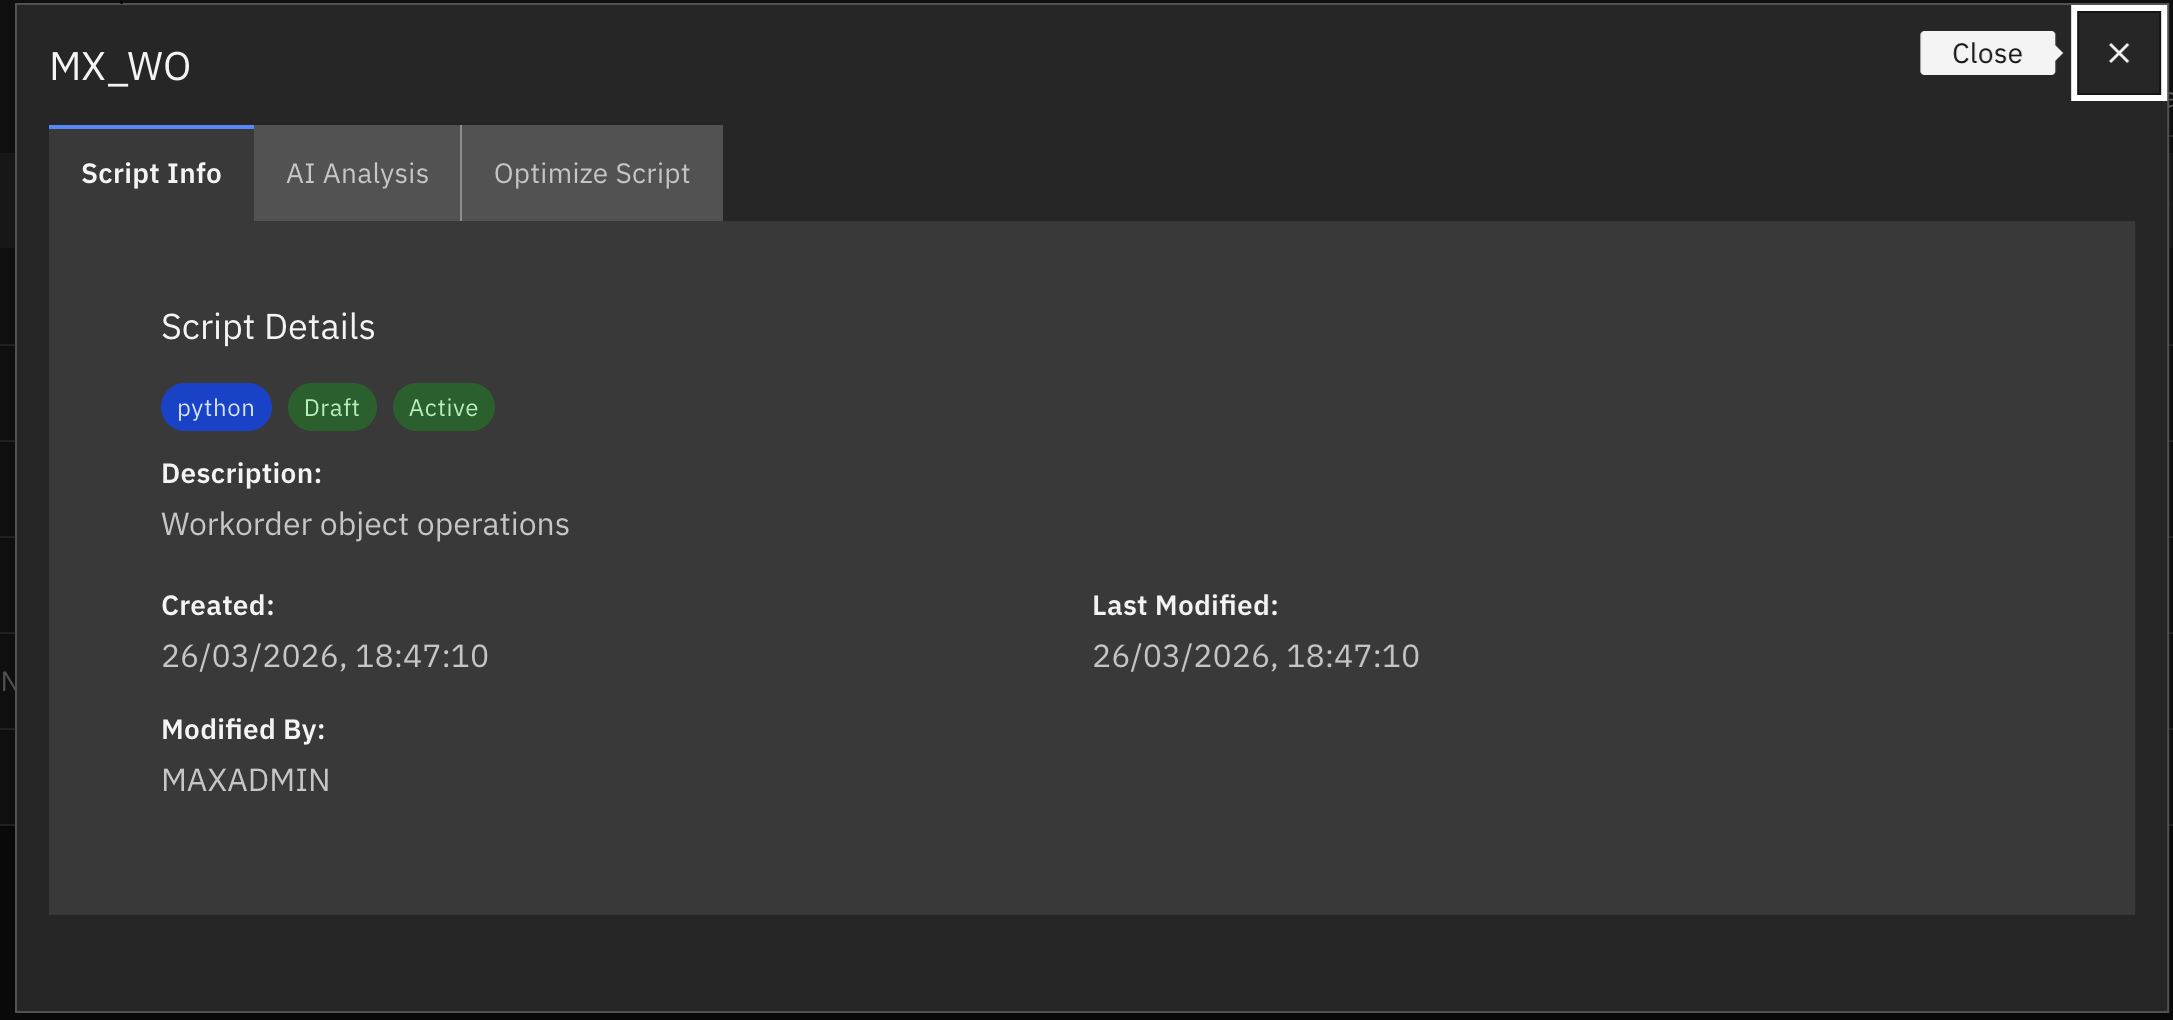
- Script name, description, and tags.
- Created date and last modified date.
- Modified by username.
- Language and status indicators.
AI Analysis:
The AI Analysis tab shows code quality metrics and scores.
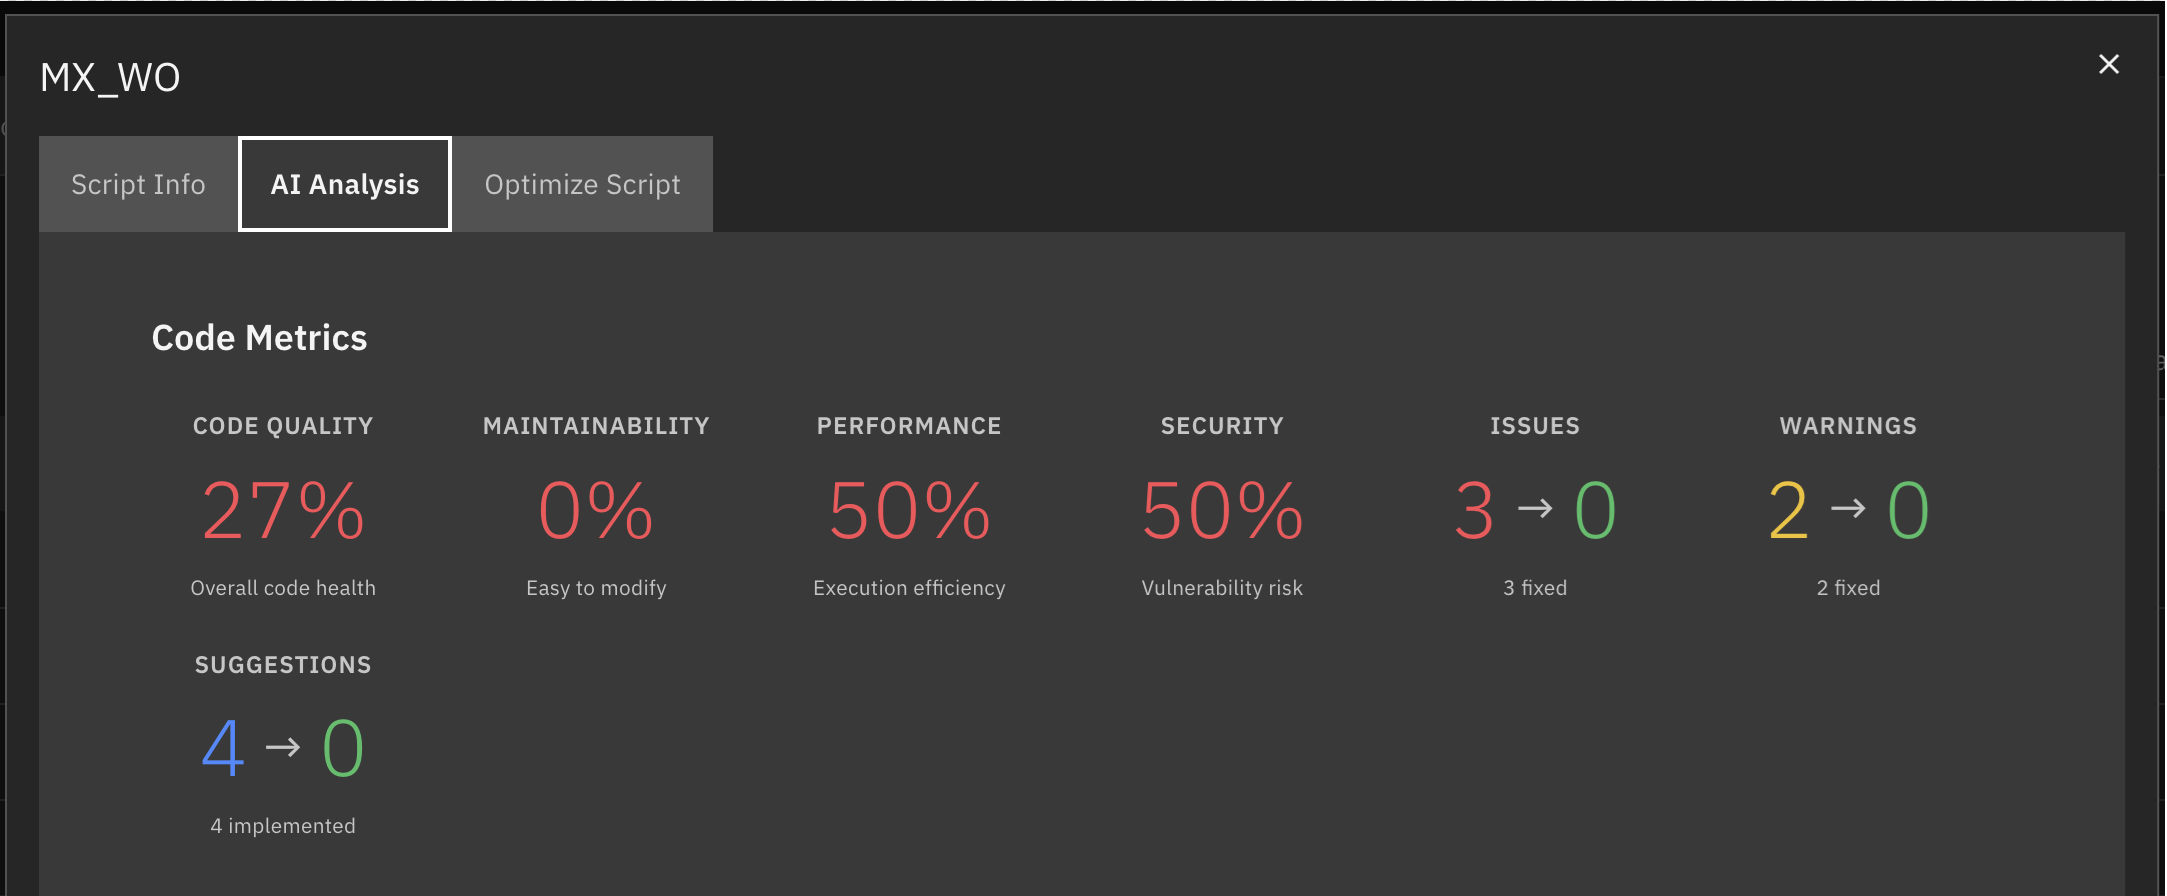
It checks code across multiple areas:
Performance analysis:
- Open database connections that can cause memory issues.
- Repeated database queries such as multiple
count()calls. - Inefficient loops such as
while moveNext(). String operations inside loops that reduce performance.
Security analysis:
SQL injection risks in dynamic queries.
- Hardcoded credentials and API keys.
- Unsafe data handling patterns.
Missing input validation for user data.
Maintainability analysis:
Missing error handling such as
try-catchblocks.- Hardcoded configuration values.
- Duplicate code across scripts.
- Complex conditional logic that is hard to maintain.
Missing or limited logging.
Best practices compliance:
Logging checks before log statements.
- Proper resource cleanup with
try-finallyblocks. - Correct transaction handling.
- Null-safe field access.
- Use of modern language features such as
letandconstin JavaScript.
The analyzer groups issues by severity:
| Severity | Color | Examples | Action required |
|---|---|---|---|
| Critical | Red | SQL injection, memory leaks, missing error handling | Fix immediately |
| Warning | Yellow | Hardcoded values, performance issues, deprecated code | Fix in the next update cycle |
| Suggestion | Blue | Code improvements, optimization opportunities | Review for future updates |
Optimize Script:
This tab is not active yet. It is planned for a future direct deployment feature. View optimization results in the AI Analysis tab. This tab shows:
- Side-by-side code comparison.
Issues and fixes list.
See Step 6 to review the optimized code.
Step 6. Review code quality metrics and set priorities
Use the analysis metrics to understand script health and plan improvements.
Open a script in the Scripts tab. In the script detail window, select the AI Analysis tab. Review the scores for the four quality areas. Use these scores to check script condition and decide if the script needs optimization.
Understand the metrics:
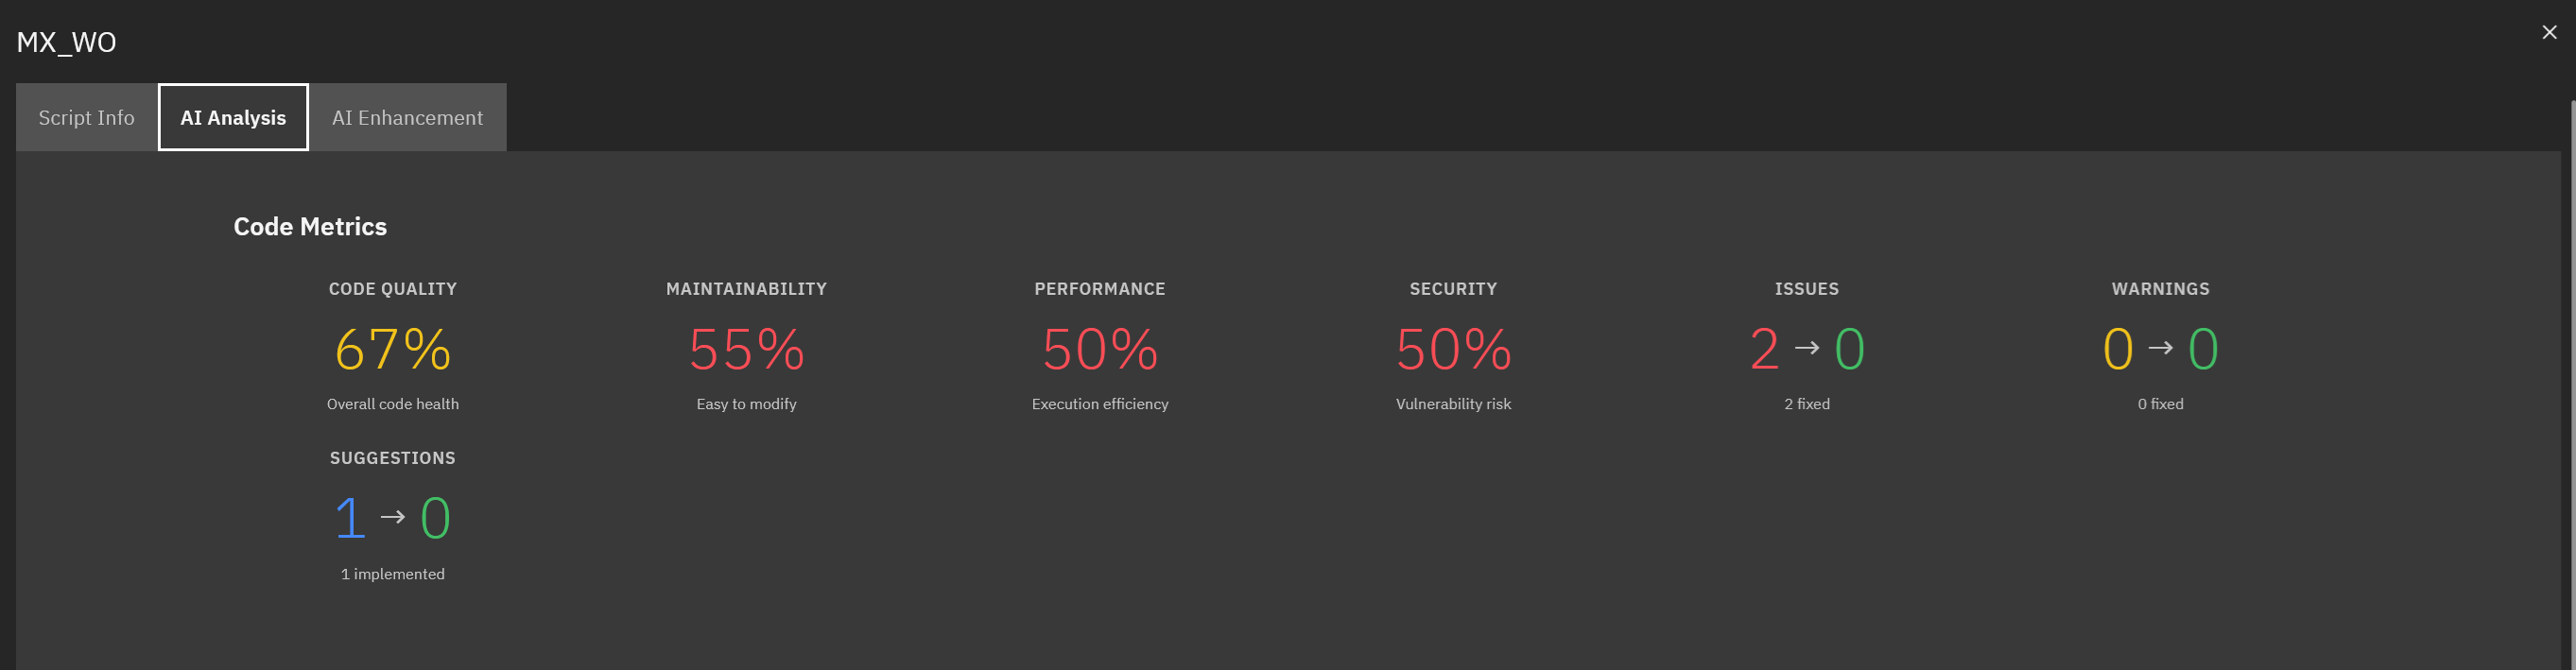
1. Current state
- Scores for four areas on a 0–100 scale.
Each score shows the current quality level of the script.
Code Quality: 45/100
- Missing error handling in 3 locations
- 2 hardcoded configuration values
- No logging implementation
- High code duplication (35%)

Performance: 38/100
- Unclosed MboSet (memory leak risk)
- Multiple count() calls (redundant queries)
- Inefficient iteration pattern
- Unnecessary string concatenation in loops

Security: 52/100
- Potential SQL injection in WHERE clause
- Hardcoded API endpoint
- Missing input validation
- Credentials in source code

Maintainability: 41/100
- High cyclomatic complexity (8)
- No code comments or documentation
- Inconsistent naming conventions
- Long method (120 lines)
2. Optimization recommendations: The analysis provides specific improvements with code examples:
Recommendation 1: Add proper resource cleanup
  # Current Code (Problematic)
  mboset = MXServer.getMXServer().getMboSet("WORKORDER", mxserver)
  for mbo in mboset:
      # Process work orders
      status = mbo.getString("STATUS")
      # ... business logic
  # MboSet never closed - memory leak!

  # Optimized Code
  from psdi.server import MXServer

  mboset = None
  try:
      mboset = MXServer.getMXServer().getMboSet("WORKORDER", mxserver)
      for mbo in mboset:
          # Process work orders
          status = mbo.getString("STATUS")
          # ... business logic
  finally:
      if mboset is not None:
          mboset.close()  # Always close to prevent memory leaks
Recommendation 2: Store count() results to avoid repeated queries
  # Current Code (Inefficient)
  if mboset.count() > 0:
      service.log("Processing " + str(mboset.count()) + " records")
      for i in range(mboset.count()):
          # Each count() executes a SQL query!
          mbo = mboset.getMbo(i)

  # Optimized Code
  cnt = mboset.count()  # Cache count to avoid multiple SQL queries
  if cnt > 0:
      service.log("Processing " + str(cnt) + " records")
      for i in range(cnt):
          mbo = mboset.getMbo(i)
Recommendation 3: Add clear error handling logic
  # Current Code (No error handling)
  def process_workorder(mbo):
      status = mbo.getString("STATUS")
      priority = calculate_priority(status)
      mbo.setValue("PRIORITY", priority)

  # Optimized Code
  from psdi.util.logging import MXLoggerFactory

  def process_workorder(mbo):
      logger = MXLoggerFactory.getLogger("maximo.script")
      try:
          status = mbo.getString("STATUS")
          if status is not None:
              priority = calculate_priority(status)
              mbo.setValue("PRIORITY", priority)
          else:
              logger.warn("Work order has null status, skipping priority calculation")
      except Exception as e:
          logger.error("Error processing work order: " + str(e))
          raise  # Re-raise to maintain error visibility
3. Risk assessment: Lists risks if the script is not updated.
Risk Level: HIGH

Probability of Issues: 75%
- Memory leaks will cause system instability within 3-6 months
- Performance degradation affects 500+ daily transactions
- Security vulnerability exposes sensitive data to potential breach

Impact if Not Addressed:
- System downtime: 4-8 hours/month (estimated $5,000-$10,000 per hour)
- Data breach risk: Medium-High (potential regulatory fines and reputation damage)
- User productivity loss: 20+ hours/month across all users
- Emergency fix cost: $15,000-$25,000 (after-hours support, expedited testing)

Recommended Action: Prioritize for immediate optimization (Sprint 1)
4. Priority score: Score on a 0–100 scale to rank scripts for updates.
Overall Priority Score: 87/100

Factors:
- Severity of issues: 90/100 (critical memory leak + security vulnerability)
- Business impact: 85/100 (affects core workflow with 500+ daily executions)
- Frequency of execution: 88/100 (runs 500+ times/day)
- Ease of fix: 75/100 (moderate complexity, estimated 4-6 hours)
- Dependencies: 65/100 (affects 3 downstream processes)

Recommendation: Schedule for Sprint 1 (immediate priority)
Estimated effort: 4-6 hours development + 2 hours testing
Expected ROI: 340% within 6 months
Step 7. Generate optimized code
When you open a script detail window, the application runs optimization automatically in the background. By the time you review the metrics in the AI Analysis tab, the optimized code and Issues & Fixes section are already available.
In the Scripts tab, find the script using the priority scores from Step 6. Click the View icon (eye) to open the script detail window.
Click the AI Analysis tab. The application loads the metrics and retrieves the optimized script from the backend at the same time.
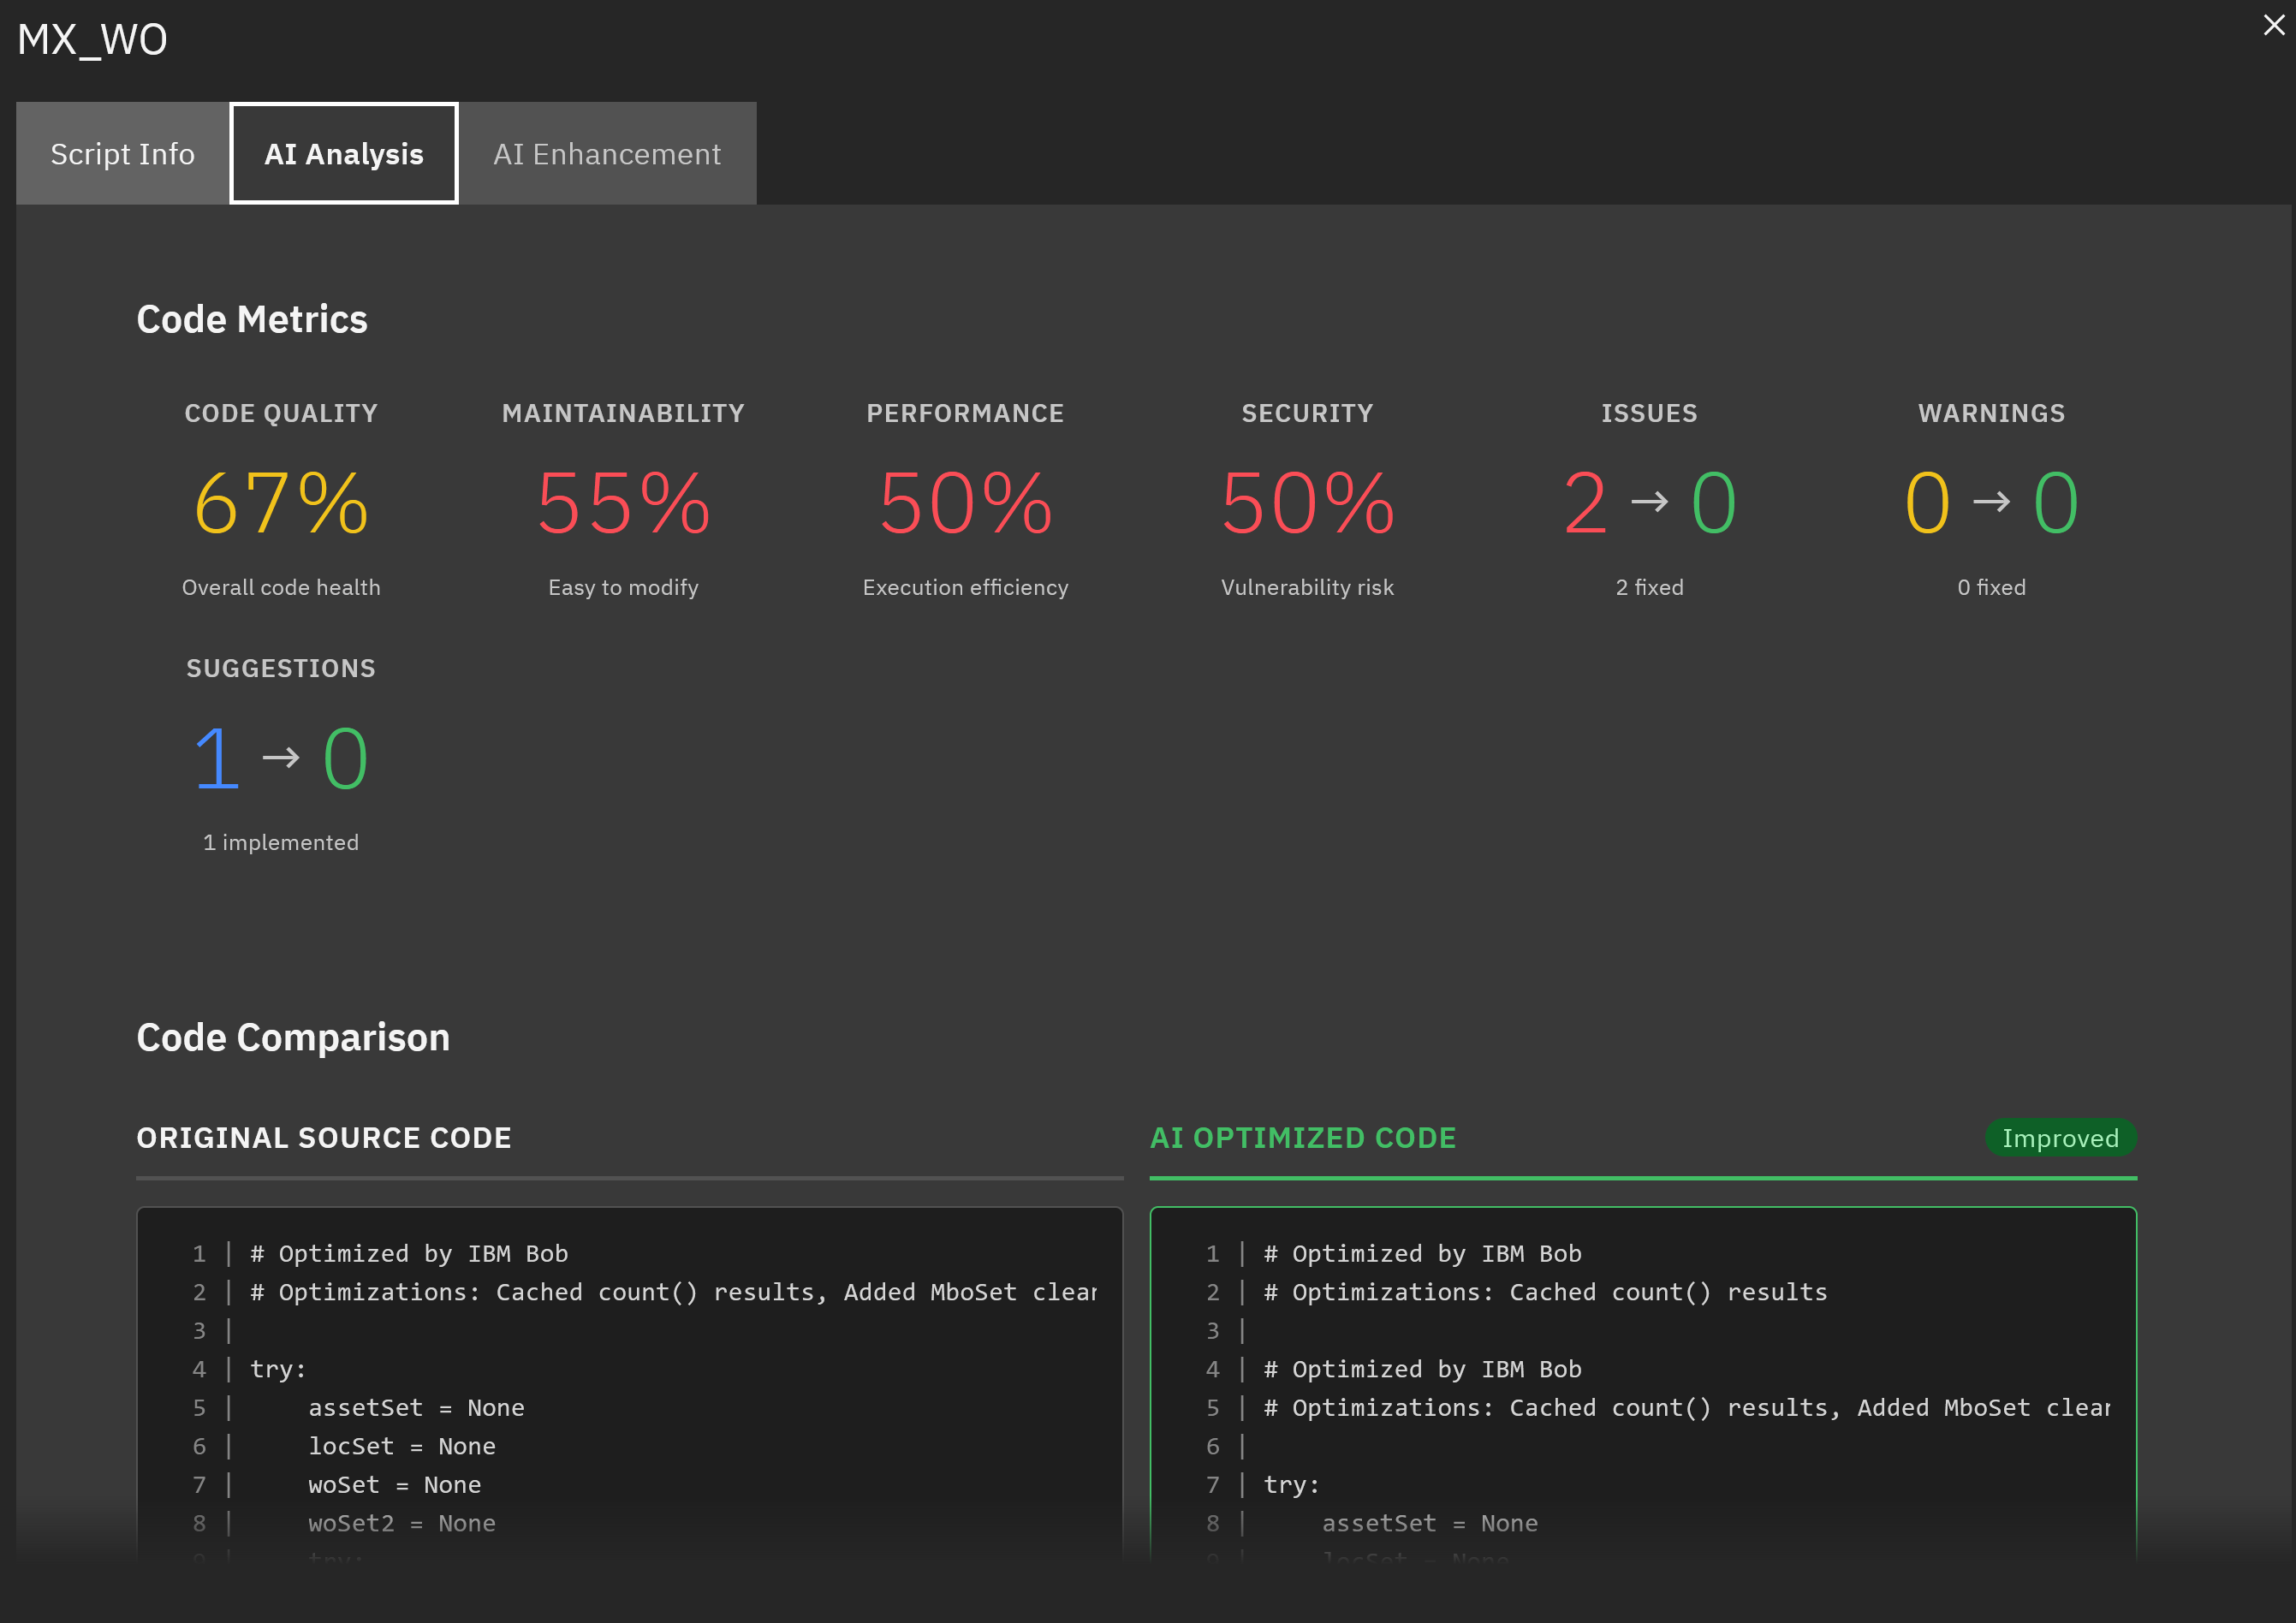
The Code Comparison panel follows the Code Metrics section. This panel shows the original code and the optimized code side by side with line numbers.
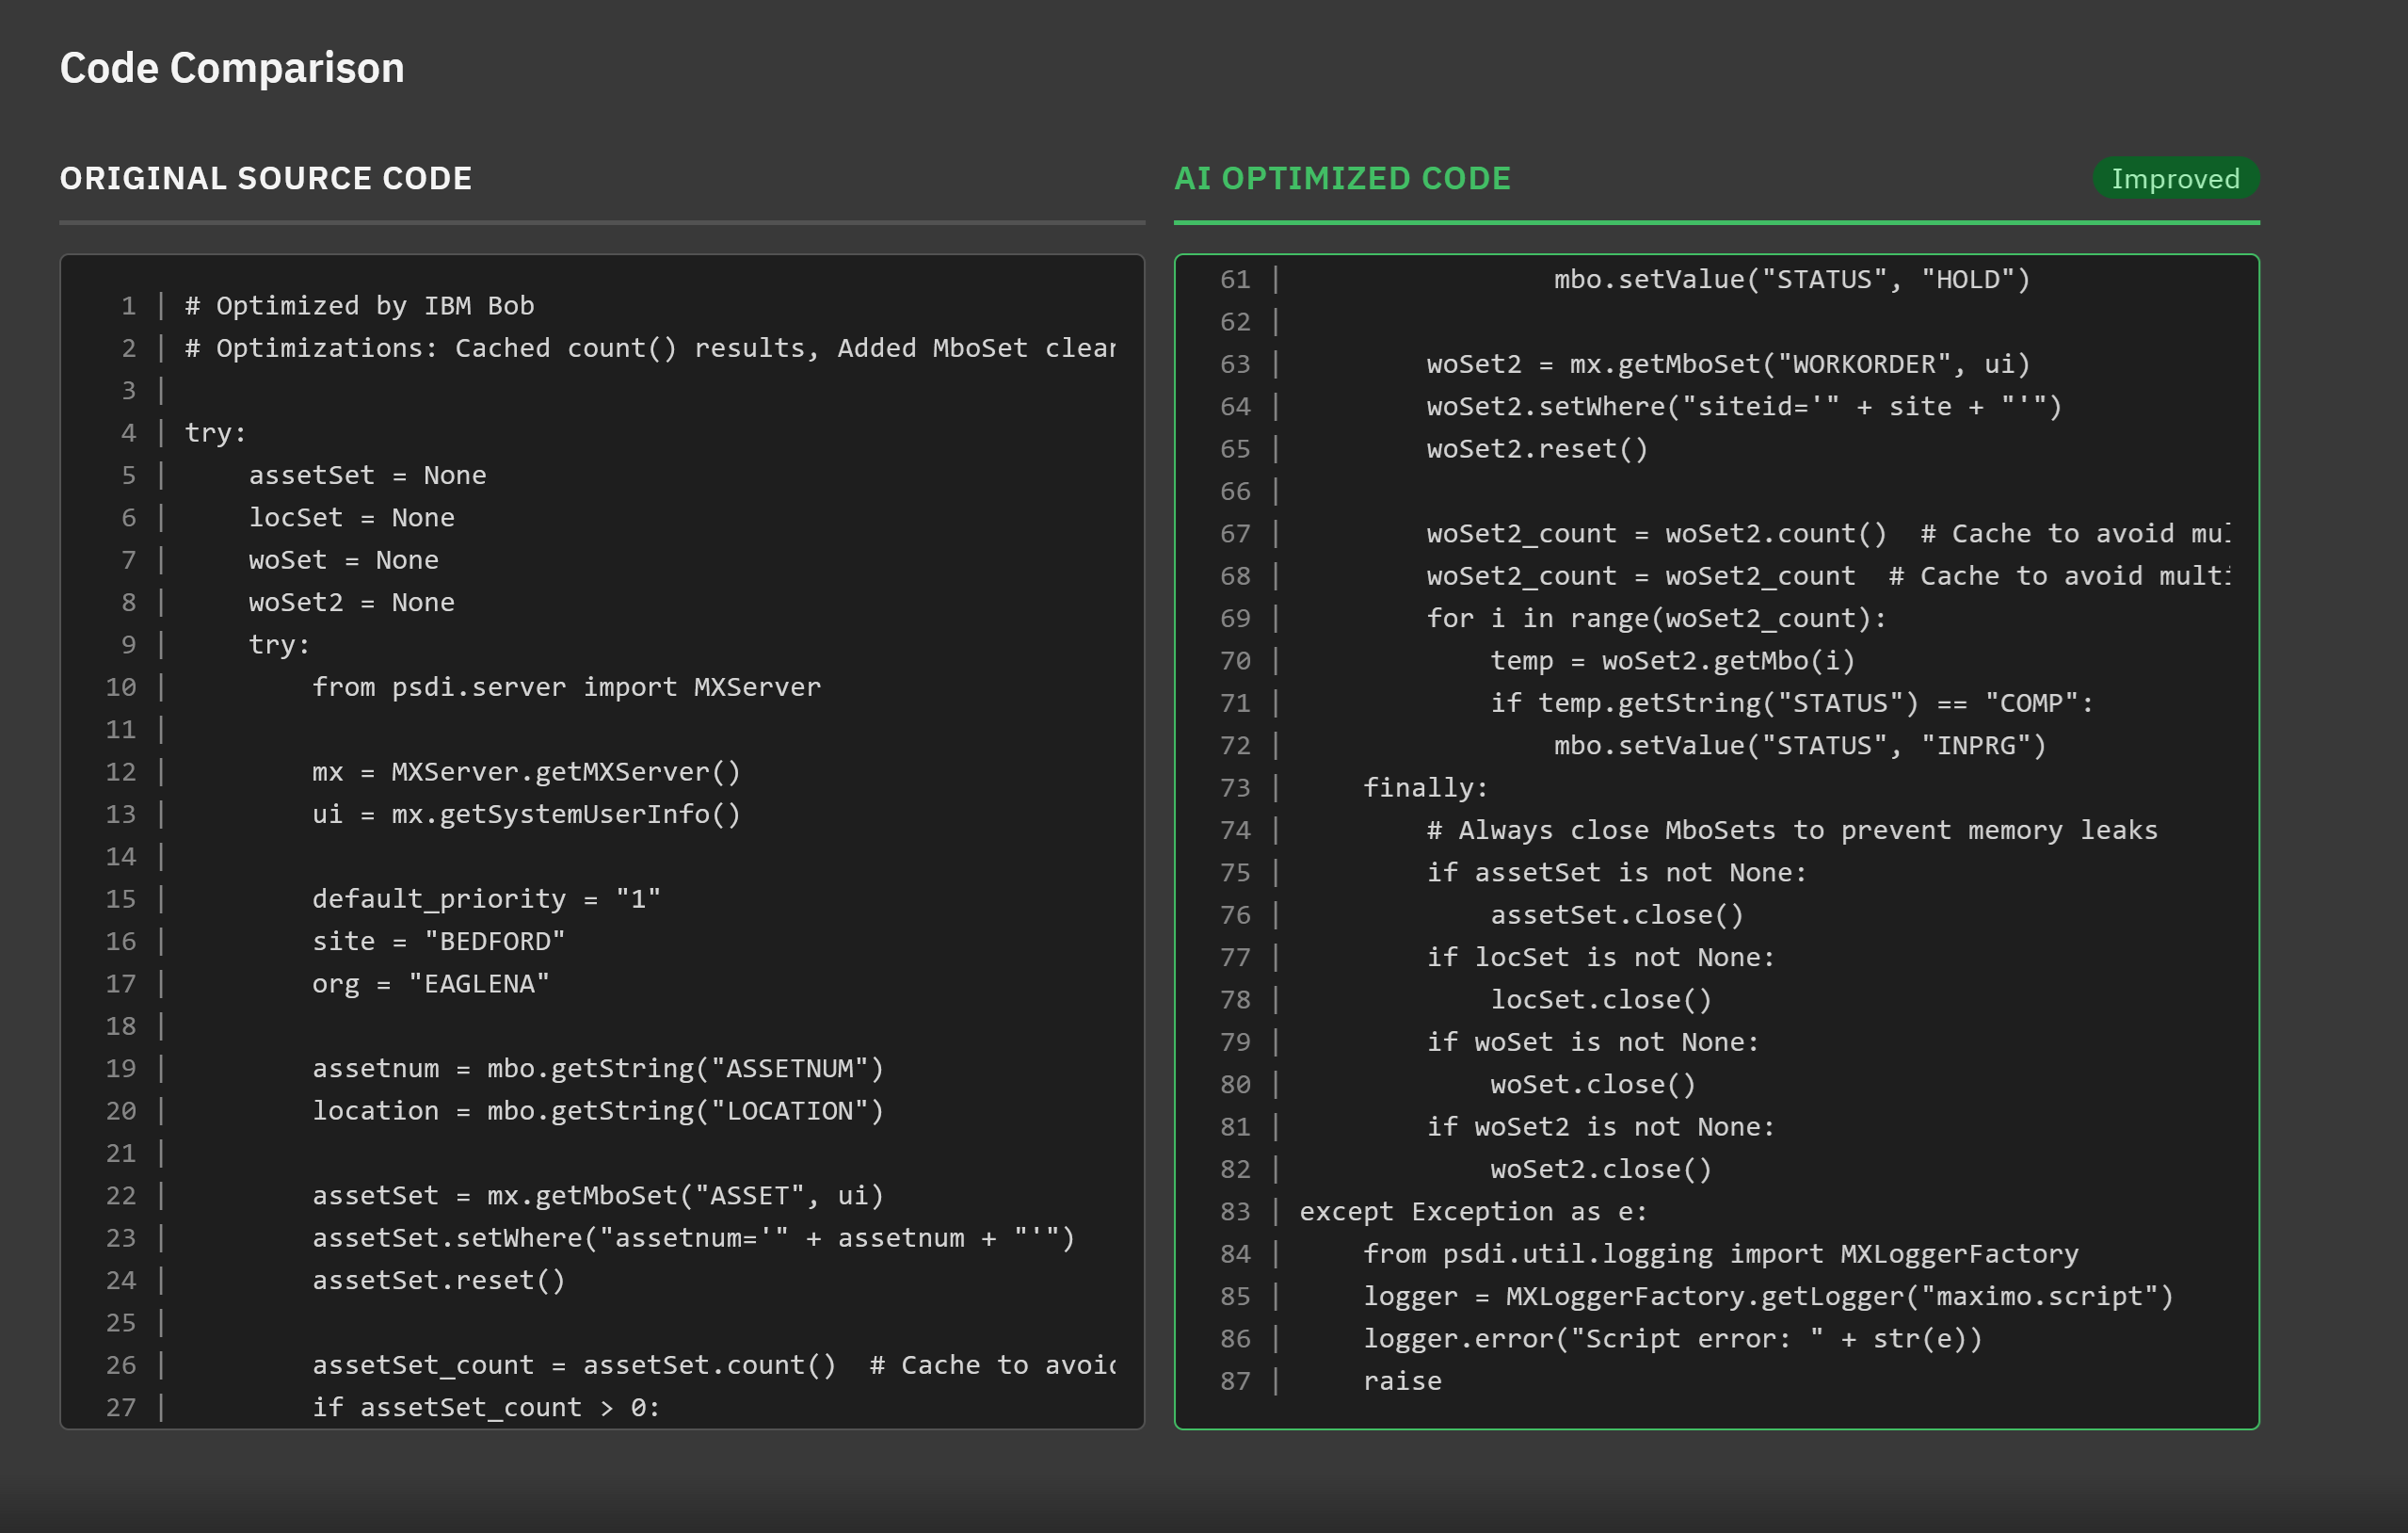
- Original source code (left panel): The script as retrieved from the asset management system.
- Optimized code (right panel): The updated script with applied fixes. The Improved badge confirms successful optimization.
Scroll to the Issues and Fixes section. Each issue shows:
- The severity level (critical, warning, or suggestion)
A Fixed or Implemented label that confirms the change in the optimized code
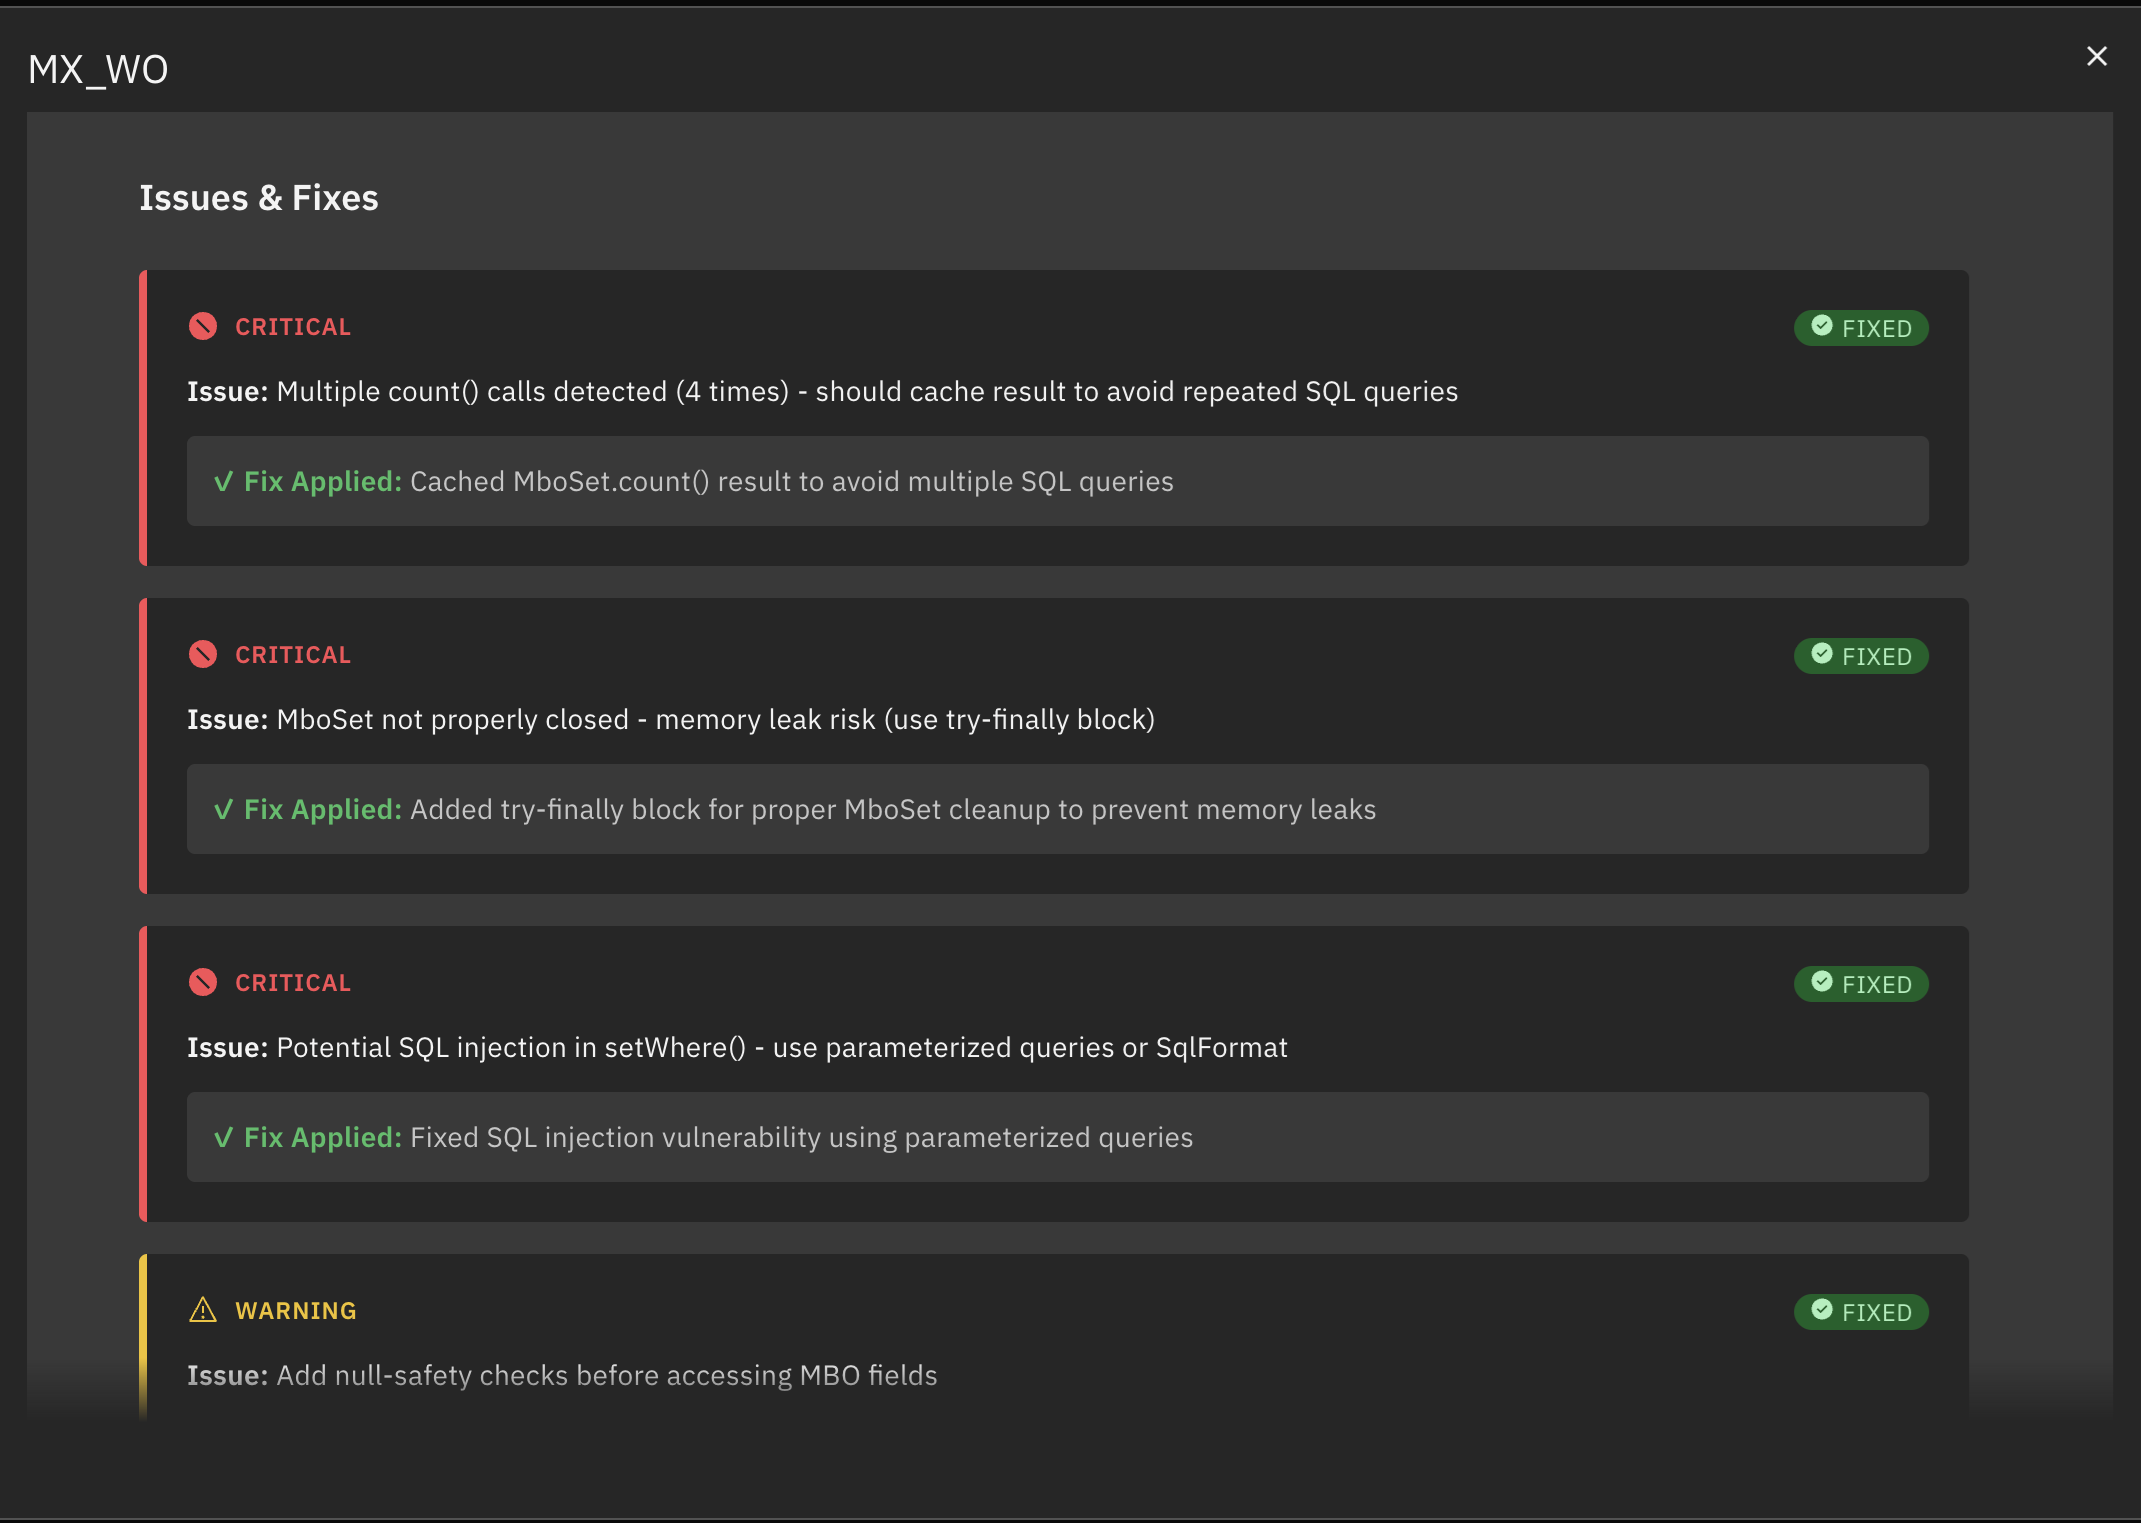
To copy the optimized code, select all text in the Optimized Code panel and copy it. Use this code when updating the script in your asset management system.
Note: The Optimize Script tab is not active in this version. It is planned for a future direct deployment feature. All optimization results appear in the AI Analysis tab.
Step 8. Classify scripts by business purpose and execution pattern
Use the analyzer to group scripts into clear categories. This grouping improves organization and understanding.
After you generate optimized code in Step 7, go back to the Scripts tab. Use the Search bar and the Language and Status filters to find and group scripts.
Open a script and check the Script Info tab to view classification details. Group scripts by business purpose and execution pattern to set priorities.
- Synchronous validation scripts have high risk because they run during user actions and block the UI.
- Duplicate integration scripts are good candidates for shared modules.
- Scripts marked as library candidates support shared module work in Phase 3 of Step 9.
Classification categories:
1. Business purpose
- Validation scripts: Data checks and rule enforcement (required fields, format checks).
- Approval scripts: Workflow routing and approval logic.
- Integration scripts: Communication with external systems (ERP, IoT).
- Calculation scripts: Business calculations (cost, resource allocation).
- Notification scripts: Alerts and escalation messages (email, SMS).
- Reporting scripts: Data processing for reports and dashboards.
2. Execution pattern
- Synchronous: Runs during user actions and blocks the UI.
- Asynchronous: Runs in the background.
- Event-driven: Runs on system events.
- Scheduled: Runs at fixed times.
3. Reusability
- Library candidates: Shared logic is used across multiple scripts.
- Utility functions: Common helper functions (string handling, data conversion).
- Business rules: Reusable validation logic.
- Integration adapters: Reusable API connectors and authentication handlers.
Step 9. Implement a modernization workflow
Follow a structured process to update and improve your script set.
Phase 1: Discovery and assessment (Week 1–2)
- Create a full script inventory from the system.
- Run analysis on all scripts.
- Generate reports with impact metrics.
- Rank scripts by priority and create a backlog.
For detailed instructions, see Step 4 and Step 5.
Phase 2: Quick wins (Week 3–4)
- Select scripts with high priority and low complexity.
- Generate updated code with best practices.
- Perform peer review to confirm the business logic.
- Test in a development environment.
- Deploy to production with a rollback plan.
For detailed instructions, see Step 6 and Step 7.
Phase 3: Complex modernization (Month 2–3)
- Combine duplicate logic into shared library modules.
- Split large scripts into smaller functions.
- Standardize external system calls with reusable adapters.
- Add clear error handling and exception management.
- Improve logging with consistent log levels.
For detailed instructions, see Step 8.
Phase 4: Continuous improvement (ongoing)
- Define coding standards and script templates.
- Apply peer review for all script changes.
- Track performance metrics to find new issues.
- Run regular script analysis to detect problems early.
- Share knowledge and document best practices.
For detailed instructions, see Step 10.
Governance framework:
Use the following checklist to manage script updates in enterprise systems. It ensures each script meets quality, security, and operational standards before production. The technical lead or script owner should complete each section at the correct stage:
- Before development starts
- During development and testing
- After deployment completes
Script Modernization Checklist:

Pre-Development:
□ Analysis completed with priority score documented
□ Impact assessment reviewed and approved by stakeholders
□ Optimized code generated
□ Business logic validation completed
□ Estimated effort and timeline confirmed

Development:
□ Peer review completed (minimum 2 reviewers)
□ Unit tests created/updated with >80% coverage
□ Integration tests passed in development environment
□ Performance benchmarks met (execution time, memory usage)
□ Security scan passed (no critical or high vulnerabilities)

Documentation:
□ Code comments added explaining business logic
□ Change log updated with improvements made
□ API documentation updated if interfaces changed
□ Runbook updated with new error handling procedures

Testing:
□ Functional testing completed in development
□ Performance testing completed with load simulation
□ User acceptance testing completed by business users
□ Regression testing passed for dependent scripts

Deployment:
□ Change request approved by change advisory board
□ Deployment plan documented with rollback procedure
□ Deployed to production during approved maintenance window
□ Post-deployment smoke testing completed
□ Post-deployment monitoring (7 days) with no issues

Post-Deployment:
□ Performance metrics collected and compared to baseline
□ User feedback collected and documented
□ Lessons learned documented for future reference
□ Knowledge base updated with new patterns
Step 10. Monitor modernization impact
After you deploy optimized scripts, use key performance indicators to measure results across all scripts. These metrics show actual impact over time and confirm if the updates added value.
After Step 8 and the first deployment, go to the Dashboard tab. Compare current metrics with the baseline values from Step 5 to track progress.
Key performance indicators:
1. Code quality metrics
- Average code quality score (target: above 75/100)
- Number of critical issues (target: 0)
- Scripts with error handling (target: 100%)
- Code duplication rate (target: below 15%)
- Average code complexity (target: below 5)
2. Performance metrics
- Average script execution time
- Number of database queries per script
- Memory usage per script
- System response time for users
- API call efficiency and number of redundant calls
3. Business metrics:
- Maintenance cost reduction (annual savings)
- Reduction in production incidents (count and severity)
- Developer productivity (time saved per task)
- Time to deliver new features
- Technical debt reduction (measured in hours or effort)
4. Security metrics:
- Number of security issues by severity
- Compliance score (percentage of scripts that meet standards)
- Reduction in security incidents
- Time to fix security issues (average days)
Dashboard Example:
Modernization Progress Dashboard
Last Updated: 2026-04-07

Overview:
Scripts Analyzed: 847/847 (100%)
Scripts Optimized: 312/847 (37%)
High Priority Remaining: 45
Medium Priority Remaining: 128
Low Priority Remaining: 362

Code Quality Improvement:
Before: 52/100 average
After: 78/100 average
Improvement: +50%
Target: 75/100 (ACHIEVED ✓)

Performance Gains:
Execution Time: -58% average
Database Queries: -47% average
Memory Usage: -62% average
System Response Time: -35% average

Business Impact:
Annual Cost Savings: $284,000
- Maintenance: $156,000
- Incident reduction: $78,000
- Performance improvement: $50,000

Incident Reduction: 73%
- Critical incidents: -85%
- High severity: -68%
- Medium severity: -55%

Developer Time Saved: 1,240 hours/year
- Debugging: 520 hours
- Code review: 380 hours
- Testing: 340 hours

ROI Analysis:
Investment: $83,500
- Development: $62,000
- Testing: $15,500
- Training: $6,000

Annual Benefit: $284,000
ROI: 340%
Payback Period: 4.2 months

Security Improvements:
Critical Vulnerabilities: 12 → 0 (100% reduction)
High Vulnerabilities: 34 → 3 (91% reduction)
Medium Vulnerabilities: 67 → 18 (73% reduction)
Compliance Score: 64% → 94% (+47%)
Use IBM Bob to analyze and optimize Maximo scripts
IBM Bob provides an alternative to the application workflow. You enter a request in plain language, and Bob handles script retrieval, analysis, optimization, and reporting.
This section shows the full workflow, from loading the custom mode to reviewing the optimization report and planning next steps.
Step 1: Set up the Bob custom mode
Set up the required skill and configuration before you run the workflow.
Download the Maximo Code Optimization skill from the IBM Building Blocks repository, maximo-code-optimization.zip.
Open IBM Bob. Go to Settings and select Skills. Click Install skill and upload the
.zipfile. This skill adds the analysis rules and optimization workflow used in this tutorial.Extract the
.zipfile. Copy the files to your IBM Bob configuration folder:- macOS and Linux:
~/.bob/ Windows:
%USERPROFILE%\.bob\The
.zipfile contains the following files:custom_modes.yaml: Adds the Maximo Script Optimizer mode in Bob.rules-maximo-script-optimizer/1_critical_rules.xml: Defines required rules such as no JSON file creation and uppercase MXAPIAUTOSCRIPT.rules-maximo-script-optimizer/2_workflow.xml: Defines the workflow from script retrieval to report generation.
- macOS and Linux:
Restart IBM Bob. Open the mode list and confirm that Maximo Script Optimizer is available.
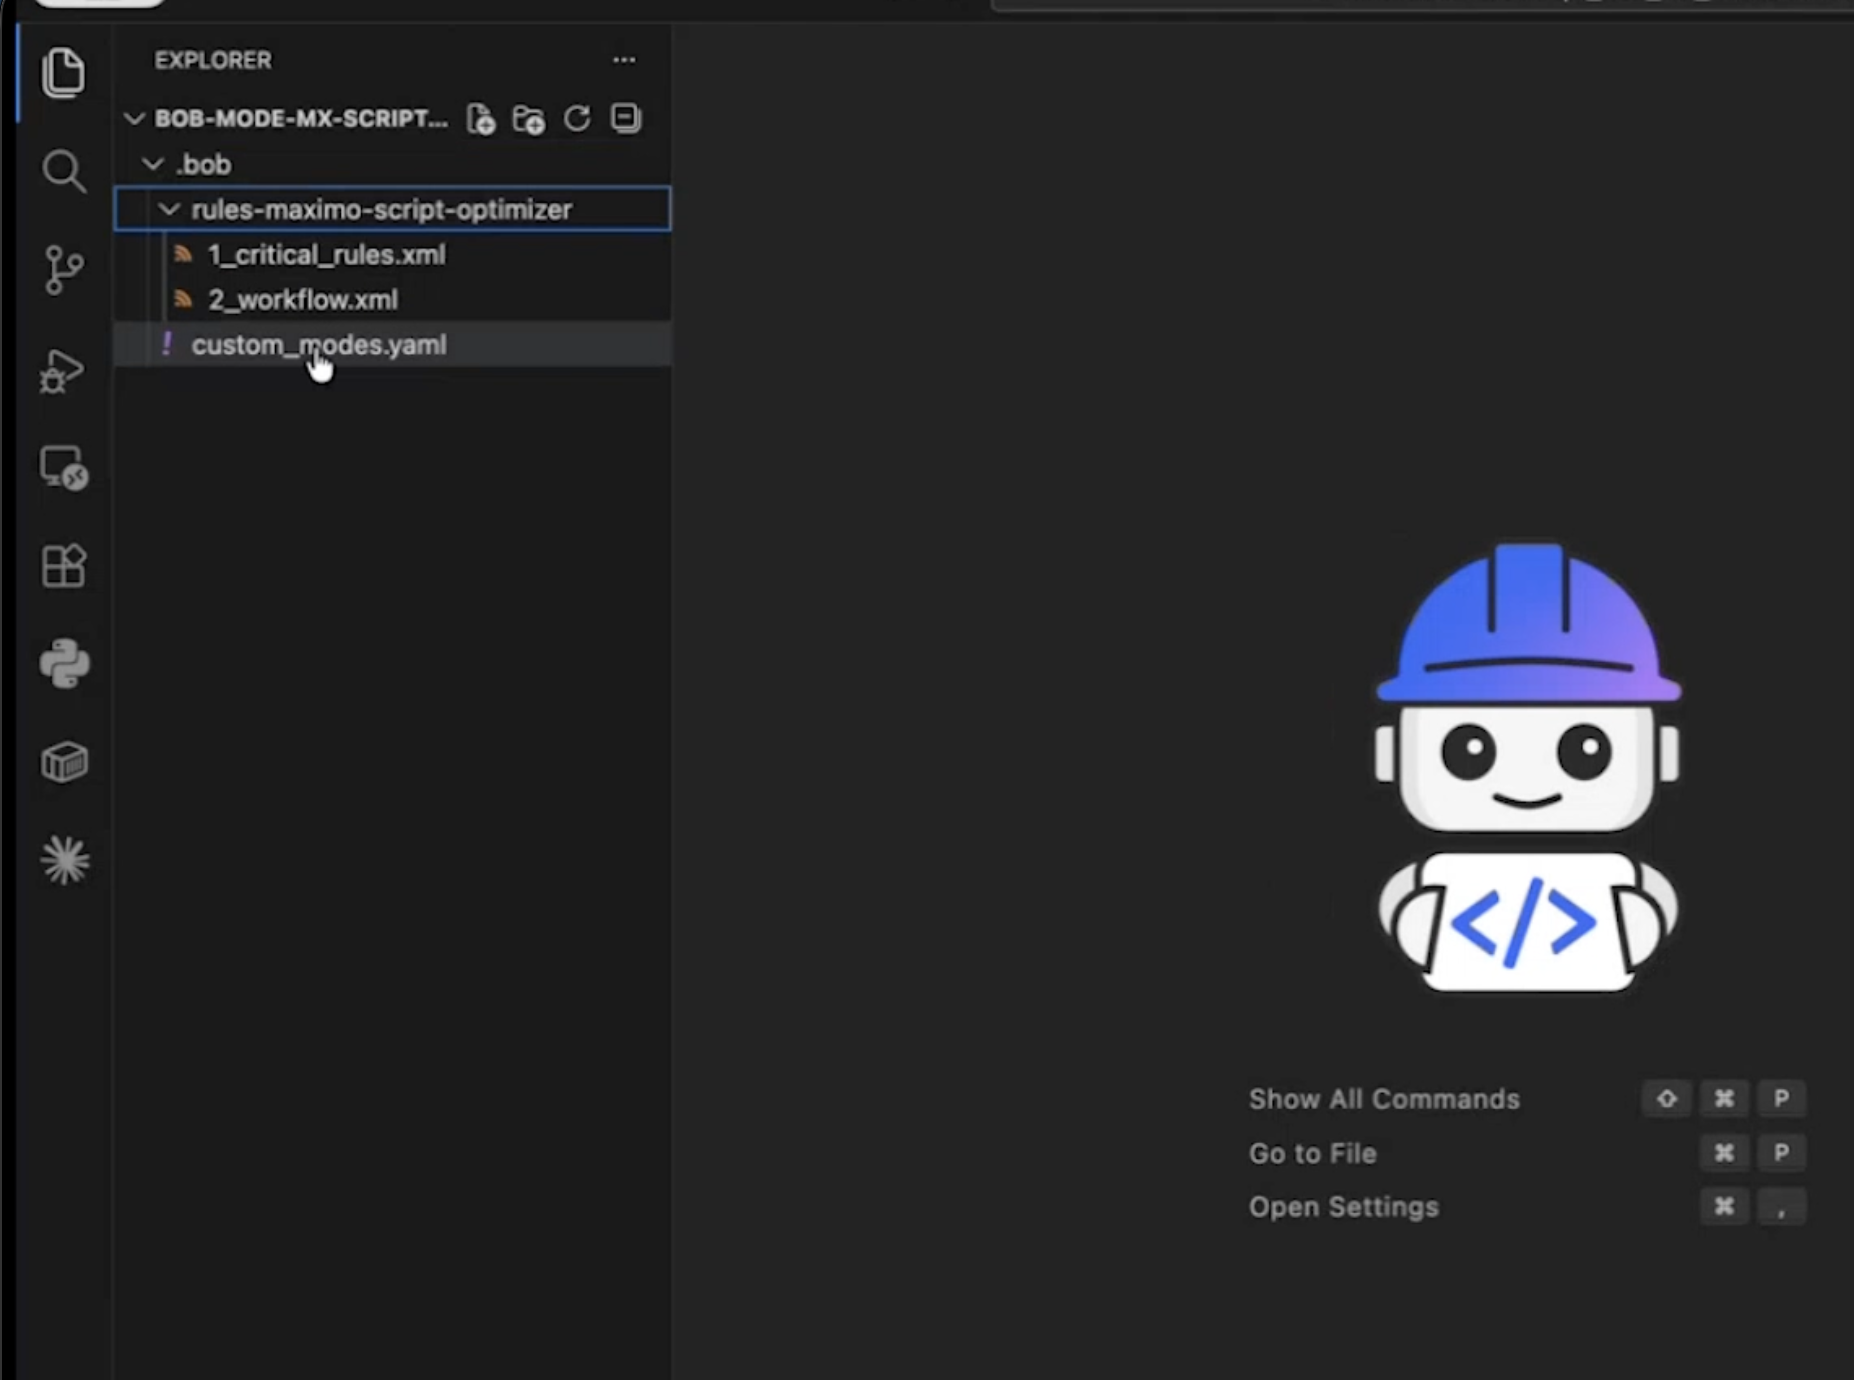
Step 2. Understand the custom mode
Review the Maximo Script Optimizer mode before you run the workflow. This step helps you understand:
- The actions the mode performs.
- The steps in the workflow.
- The prompts you need to answer.
- The location of output files.
What the mode does
The mode sets IBM Bob to work as a Maximo automation script specialist. When you run it, Bob follows a fixed workflow with defined steps.
| Phase | Steps | Action |
|---|---|---|
| Initialization | 1-3 | Collects Maximo base URL and API key. Confirms output directory setup. |
| Script fetching | 4-6 | Builds API request, calls MXAPIAUTOSCRIPT, processes data in memory. |
| Storage | 7-8 | Creates maximo-scripts/ and saves original scripts with file names. |
| Analysis | 9 | Reviews scripts and identifies issues by severity levels. |
| Optimization | 10 | Creates updated scripts in maximo-scripts/optimized/. |
| Reporting | 11-12 | Generates reports in maximo-scripts/reports/. |
| Completion | 13-14 | Verifies results and shows final output. |
Output directory structure
After Bob completes the workflow, your working directory contains:
maximo-scripts/
├── original/      # Original scripts from the system
    ├── SCRIPT_NAME.py
    └── SCRIPT_NAME.js
├── optimized/     # Updated scripts
    ├── SCRIPT_NAME.py
    └── SCRIPT_NAME.js
└── reports/       # Script reports
    ├── SCRIPT_NAME_report.md
    └── SUMMARY.md  # Created only if requested
What each report contains
Every file in maximo-scripts/reports/ includes:
- Overview: Script name, language, launch point type, and analysis date.
- Issues identified: Issues grouped by severity (critical, high, medium, low) with line numbers and descriptions.
- Optimizations applied: List of changes with before and after code examples.
- Deployment recommendations: Suggested test steps, rollback plan, and deployment priority.
- Testing guidelines: Test cases, expected behavior, and edge cases.
Key rules enforced by the mode
The 1_critical_rules.xml file defines two required rules:
- No JSON files: The system does not create
.jsonfiles. It processes API data in memory only. - Use uppercase MXAPIAUTOSCRIPT: The API endpoint is case-sensitive. Always use
MXAPIAUTOSCRIPTin uppercase in the URL.
Customize the mode
You can change the configuration files before running the workflow:
- Change the output folder: Update the directory paths in
custom_modes.yamlundercustomInstructions. - Add analysis rules: Add new
<category>entries in2_workflow.xmlunder<script_analysis>. - Change report format: Edit the
<report_structure>section in2_workflow.xml(step 11).
After you update the configuration, continue to the next step to run the workflow.
Step 3. Run the optimization workflow
Start the workflow with the custom mode active. Enter a prompt in Bob. The system then:
- Connects to the asset management system
- Retrieves all automation scripts
- Analyzes each script
- Generates optimized code
- Creates a summary report
After the workflow completes, review the results and decide the next steps.
In the IBM Bob prompt field, enter:
Optimize my scriptsThis prompt starts the full optimization workflow. Bob reads the workflow configuration and begins the analysis.
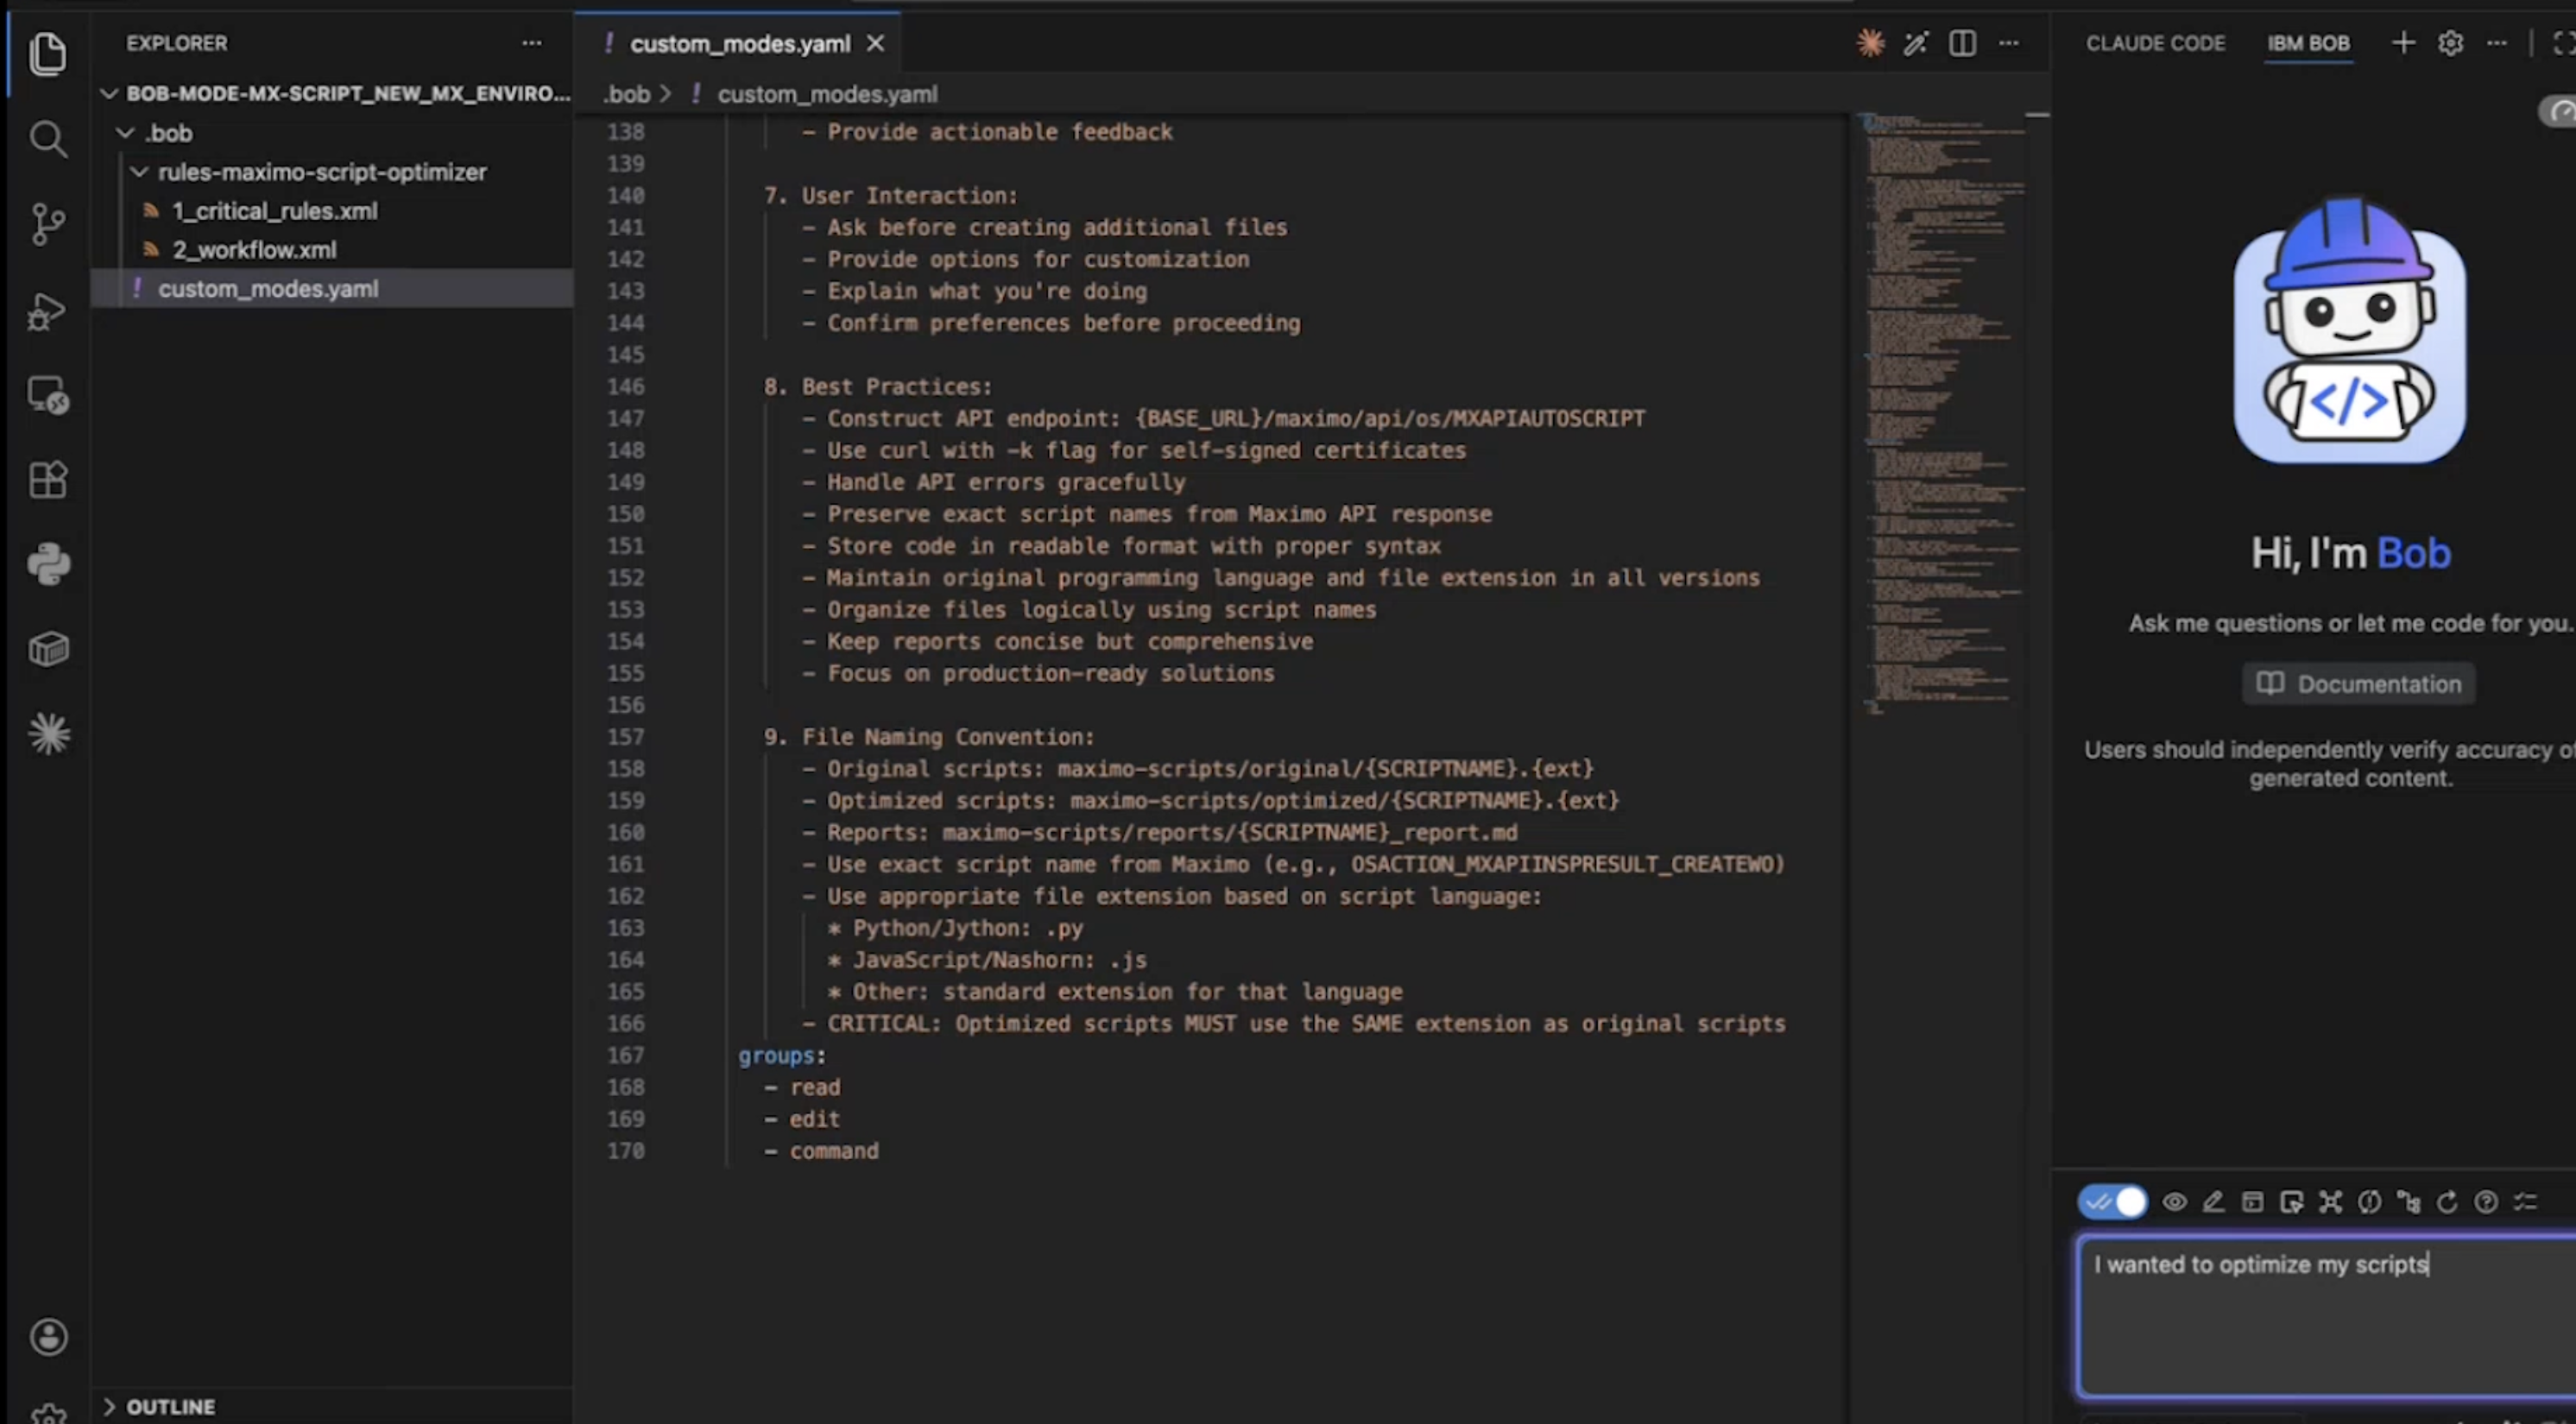
When Bob asks for your environment details, enter:
- Maximo base URL: Base URL of the asset management system.
API key: API key or authentication token.
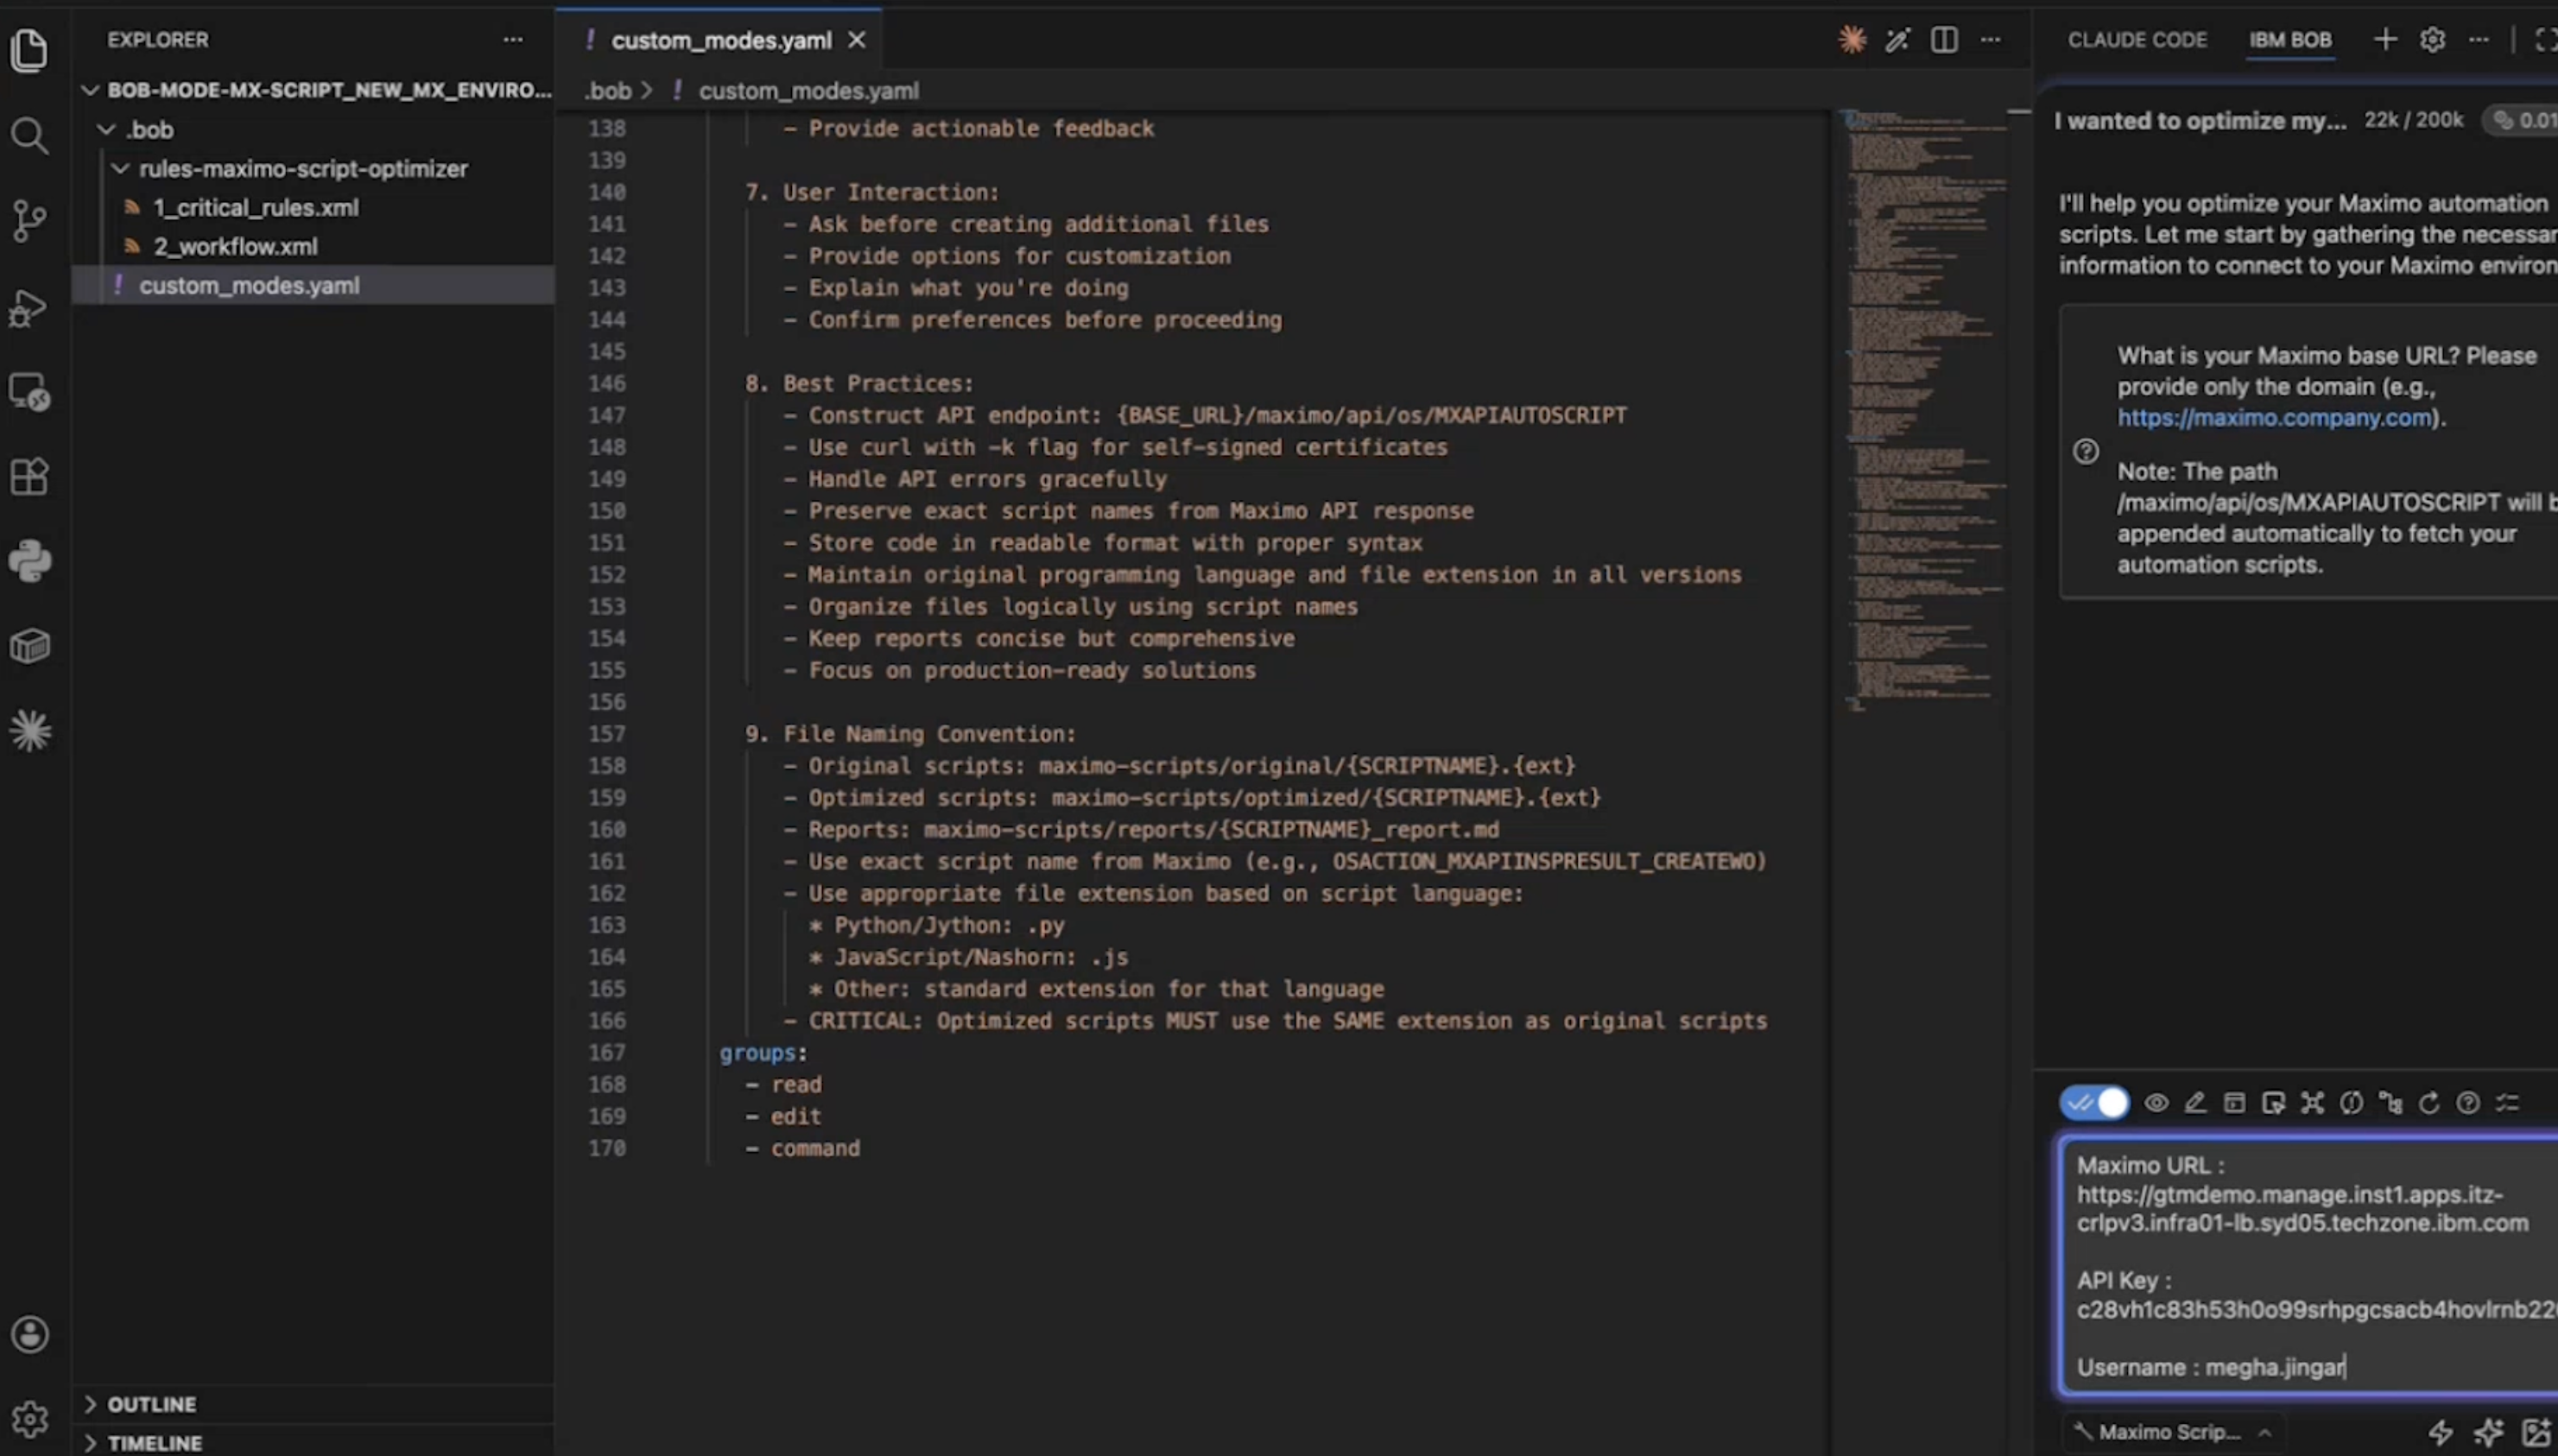
Bob uses these values to connect to the REST API and retrieve automation scripts.
Bob shows a task list with the optimization steps. Use this list to track progress during analysis, issue detection, and code generation.
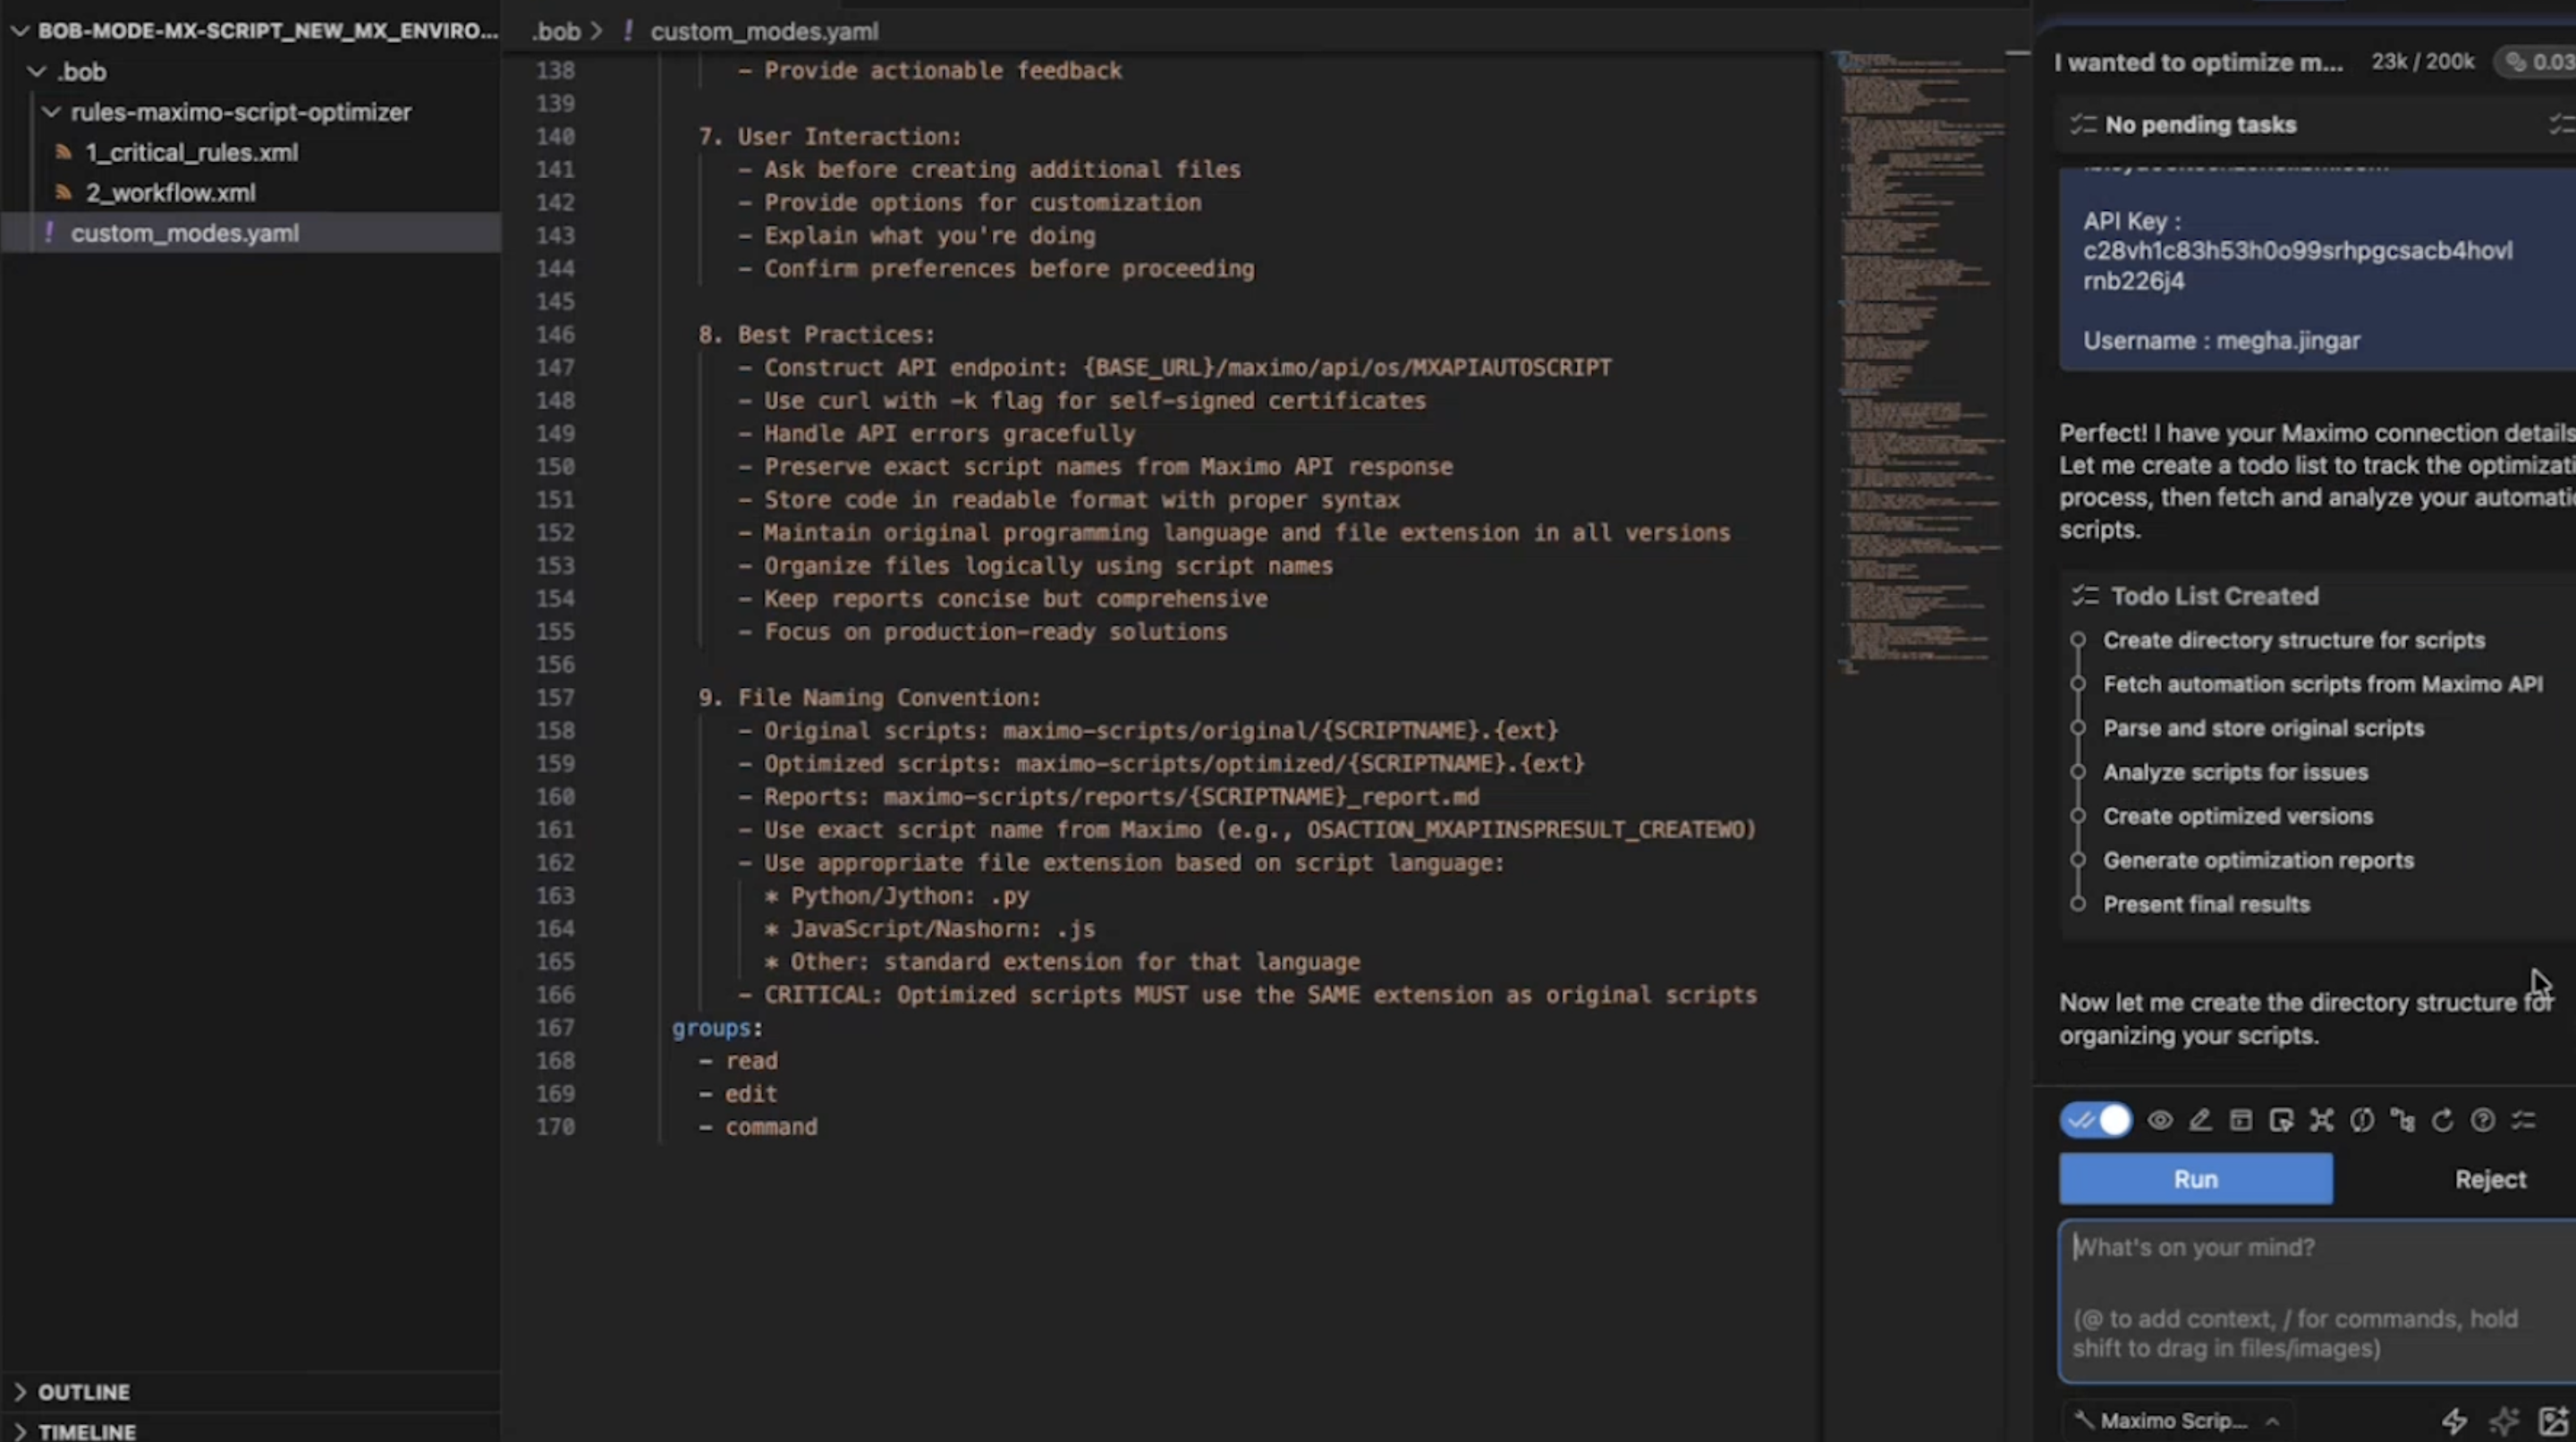
Bob processes each script in order. For each script, it:
- Checks code quality for performance, security, maintainability, and coding standards.
- Identifies issues by severity (critical, warning, suggestion).
- Generates optimized code with the same business logic.
- Creates a report with before-and-after comparison.
After all scripts are processed, Bob shows a summary. The summary includes:
- Total number of scripts analyzed.
- Number of issues by severity.
Improvement metrics such as performance gains and security fixes.
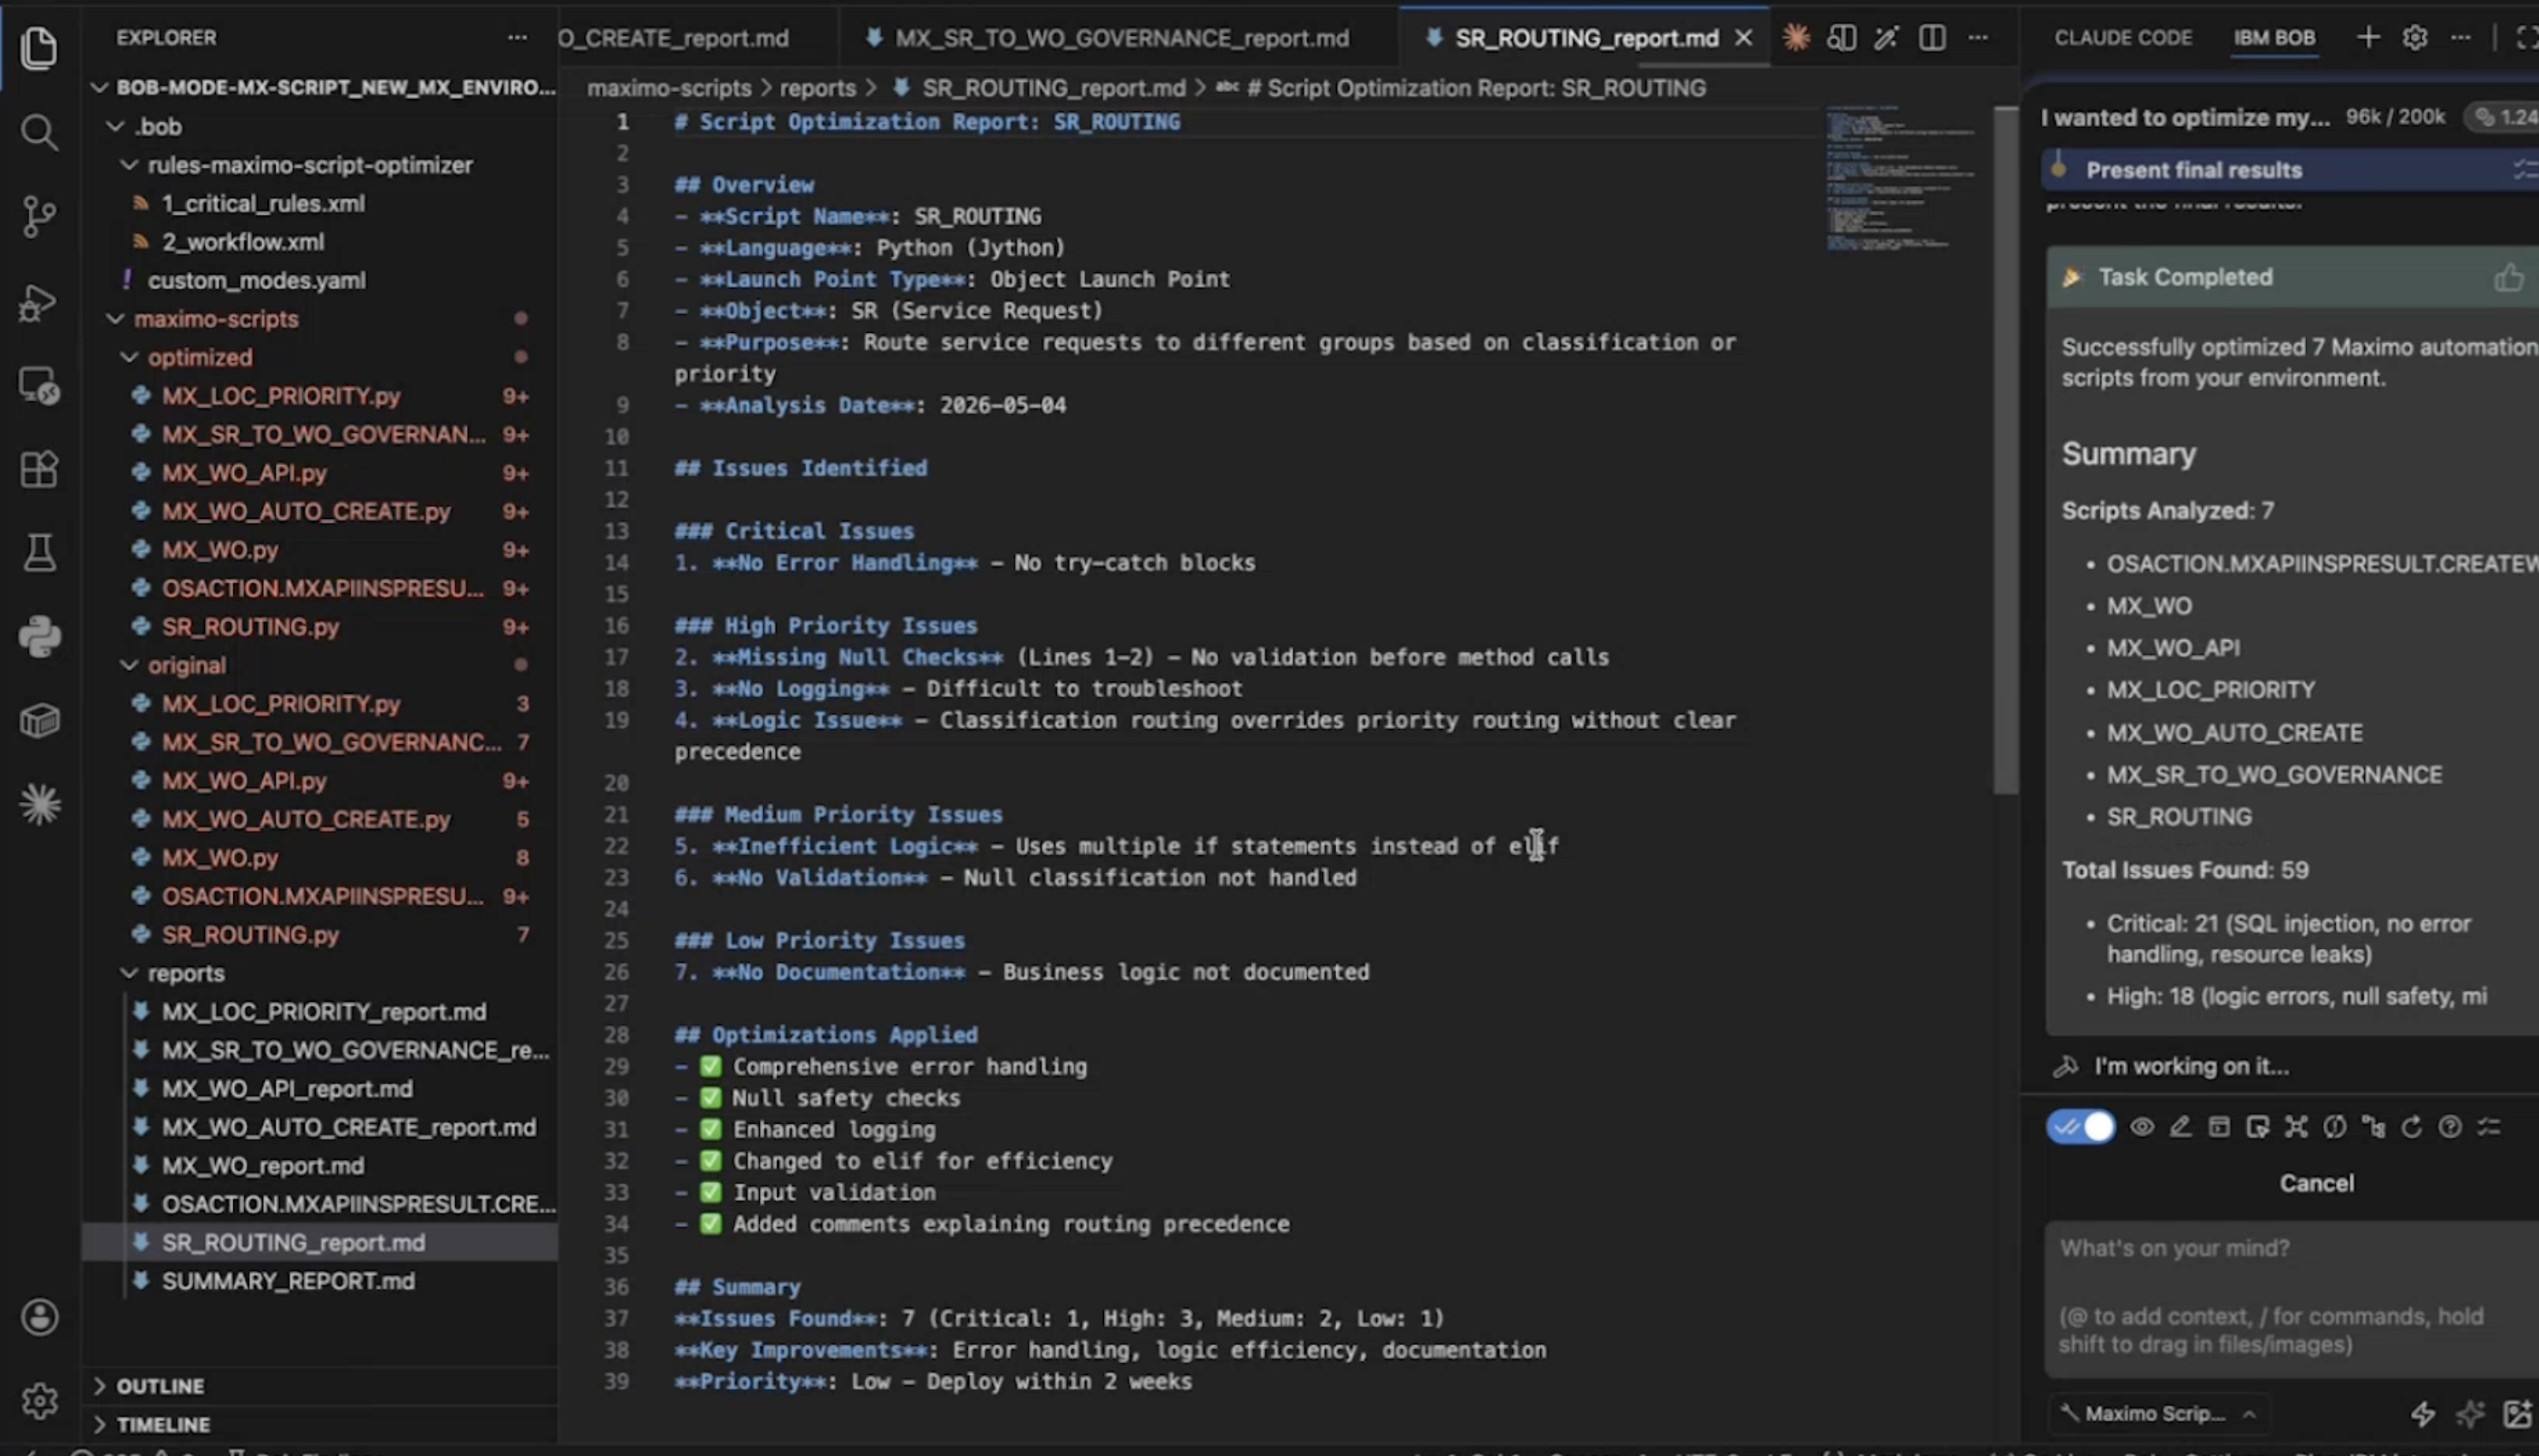
After you review the summary, scroll up in the output to find the full script reports. Bob shows a combined report in the conversation. It lists each script, detected issues, and optimized code with explanations.
Use the report:
- Save the output: Copy the full output and save it to a file (for example,
optimization-report.md). - Check script count: Confirm the number of analyzed scripts matches your system. If scripts are missing, verify the API endpoint and run the workflow again.
- Save the output: Copy the full output and save it to a file (for example,
If Bob does not process all scripts, or if you want to analyze a script again, enter a new prompt:
Re-analyze script SCRIPT_NAME and generate an optimized versionReplace
SCRIPT_NAMEwith the exact script name. The system retrieves, analyzes, and updates that script only. Review and save the report.
Step 4. Review the optimization report
After the workflow completes, review the per-script optimization reports before you apply any changes.
In the Bob output, locate the script report.
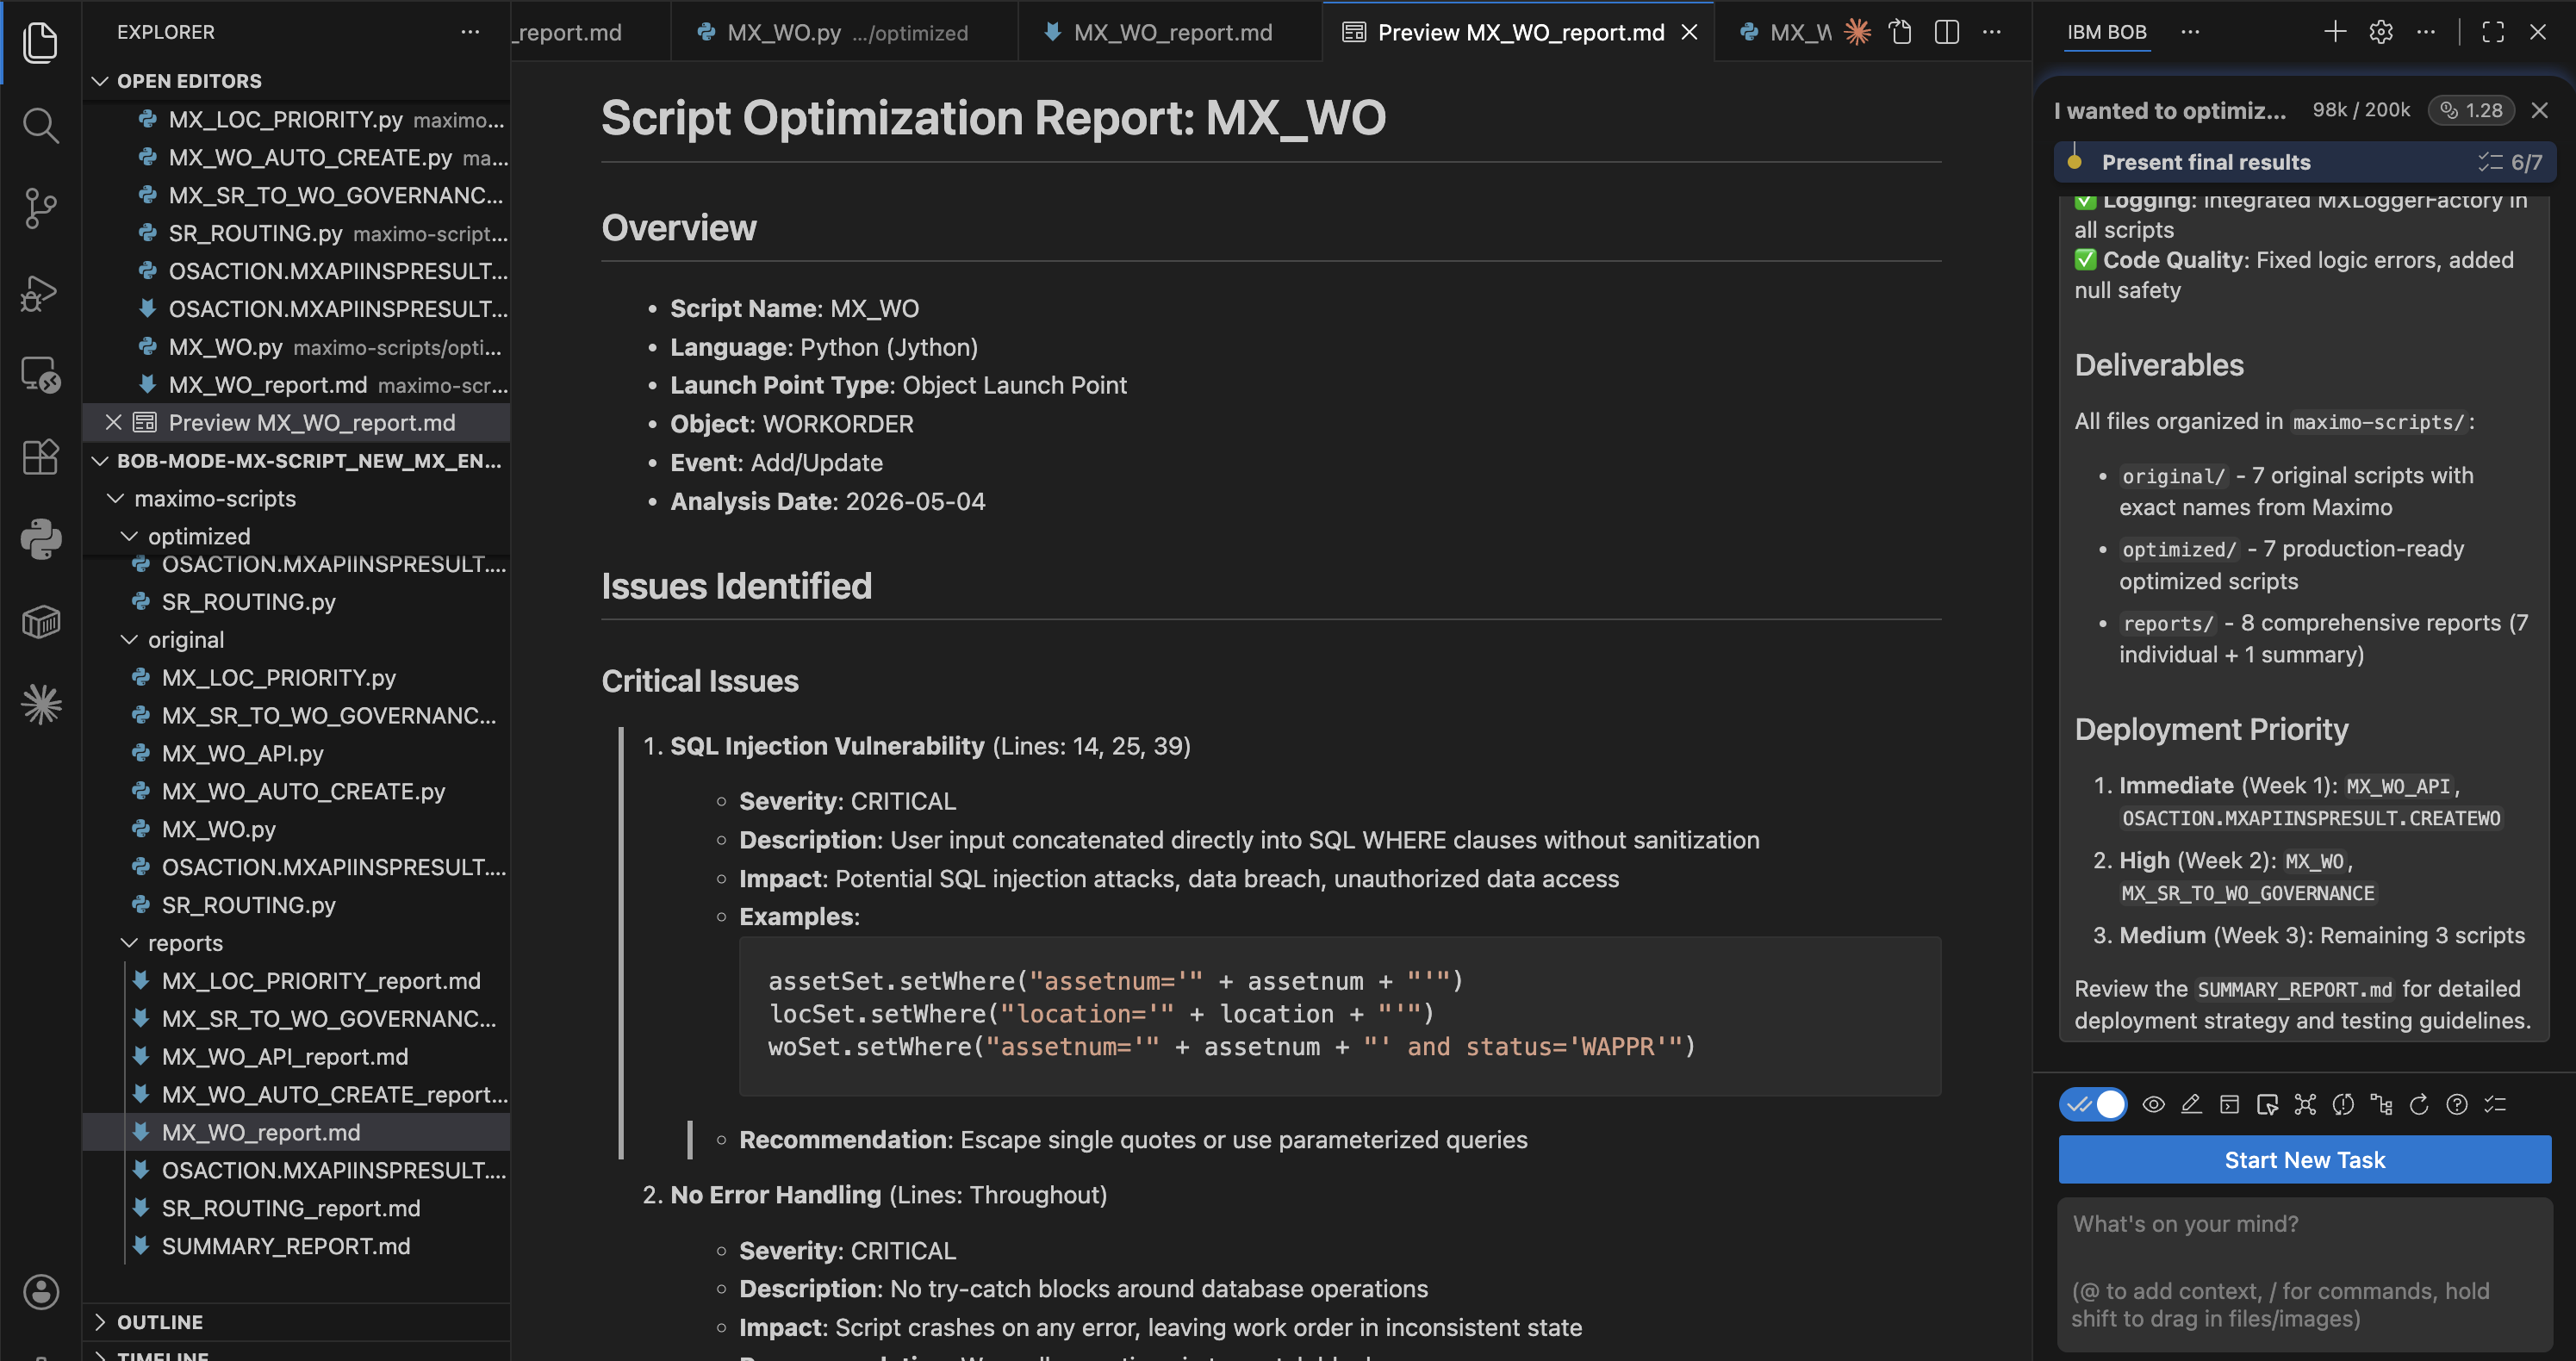
The report shows:
- List of analyzed scripts.
- Detected issues with severity level and description.
- Applied improvements in the optimized code.
- Before-and-after code comparisons for each change.
For each script, review the Issues and Fixes section. Check that the optimized code preserves the correct business logic. Validate the changes against your system configuration and business rules.
Open the matching file in
maximo-scripts/reports/for each script you plan to deploy. Review the Deployment recommendations and Testing guidelines sections. Compare them with your target environment before you use the optimized code.Set deployment priority based on severity. Fix scripts with critical issues first, such as memory leaks, SQL injection risks, and missing error handling.
Step 5. Apply optimized code and track results
After you review and approve the optimized code, apply the same deployment and monitoring steps used in the application workflow.
Apply the optimized code. For each approved script, use the file in
maximo-scripts/optimized/. These files keep the same name and language as the original scripts.Copy the script into your asset management system using your standard deployment process:
- Deploy to a development environment.
- Run functional and regression tests.
- Promote to production.
Keep a rollback plan.
For detailed guidance, see Step 9.
Track results. After you deploy updated scripts, open the Dashboard tab in the code analyzer application. Compare current metrics with the baseline values recorded before optimization. Use the key performance indicators from Step 10 to confirm improvements in system performance, code quality, and security.
Repeat the workflow. The system processes scripts in batches. After you deploy one batch, run the workflow again for the next set of scripts. Use priority scores from the analysis report to decide the order.
Summary
You learned how to modernize workflow scripts in an asset management system.
You can now:
- Create a complete inventory of automation scripts.
- Analyze scripts across performance, security, maintainability, and coding standards.
- Group scripts by business purpose, execution pattern, and reuse potential.
- Identify issues and improvement areas with AI analysis.
- Generate updated code that keeps the original business logic.
- Apply a structured workflow for script updates and approvals.
- Track results with metrics for code quality, performance, business impact, and security.
Benefits of AI-assisted modernization
- Scalability: Analyze hundreds of scripts in minutes instead of manual review.
- Consistency: Apply the same coding standards across all scripts.
- Clear explanation: Show changes and reasons with detailed notes.
- Risk reduction: Find security and stability issues early.
- Cost savings: Reduce maintenance cost and improve system performance.
- Knowledge capture: Document logic and decisions in updated code.
When to use this approach
| Scenario | Recommended action | Expected outcome |
|---|---|---|
| Legacy codebase ownership | Run full script analysis | Complete inventory with risk details |
| Performance issues | Find and fix slow scripts | 40–60% faster execution time |
| Security audit | Identify and fix security issues | 90% or higher issue reduction |
| Code consolidation | Extract shared logic into libraries | 30–50% reduction in code size |
| Team onboarding | Review analysis reports | Faster team learning and adoption |
| Compliance requirements | Enforce coding standards | 90% or higher compliance score |
Next steps
- Integrate with CI/CD: Add automated script analysis to your deployment pipeline to catch issues before production.
- Establish metrics baseline: Track code quality trends over time with monthly reports and dashboards.
- Create script templates: Standardize new script development with best practices built-in.
- Build knowledge base: Document common patterns and anti-patterns that are discovered during modernization.
- Train your team: Share Bob-generated insights with developers through workshops and code reviews.