Article
Collecting and transporting a JFR dump from a containerized environment
Configuring and recording a JFR dump from a running Semeru application in an Openshift containerJDK Flight Recorder (JFR) was introduced in IBM Semeru Runtimes v11.0.27, v17.0.15 and v21.0.7 releases. JFR provides an industry standard, low overhead, continuous workload monitoring experience to the users of Semeru-based Java workloads that are running in containerized or conventional deployment targets.
In containerized environments like Red Hat OpenShift, diagnosing performance issues in Java applications often requires capturing JFR data. However, collecting and transporting these recordings from ephemeral, isolated containers poses logistical and technical challenges.
Traditional monitoring tools often assume direct or SSH access to the host, which is typically restricted in modern cloud-native environments. In addition, many container environments inhibit persistent volumes, so the diagnostic data needs to be taken out through manual means, before the container is recycled. Without streamlined methods to securely extract and manage JFR files, root cause analysis can be delayed, affecting application reliability and supportability.
To address these challenges, we need a well-defined set of tasks to be carried out to perform the application monitoring and performance analysis seamlessly. This article provides the steps to configure and record a JFR dump from a running Semeru application in a containerized environment (specifically an OpenShift environment) and transport it to your local system, with the assumption that you do not have SSH access to the pod that is running the container.
Set up your environment
Make sure rsync is installed beforehand. Perform this step in the Dockerfile itself while defining the image. This step is only required if your JFR dump is abnormally large (more than 2GB).
# sudo apt install rsync
Next, make sure you have the ability to execute shell scripts in the remote OpenShift container.
Login to Openshift:
# oc login --token=<your_token> --server=<your_cluster_api>
Locate the target pod:
# oc get pods -n <namespace>
Locate the container within the pod:
# oc get pod <pod> -n <namespace> -o jsonpath='{.spec.containers[*].name}'
Issue sample commands or shell scripts inside the container:
# oc exec -n <namespace> <pod> -c <container> -- /bin/sh -c <cmd>
For example:
To list files in the root directory:
# oc exec -n my-namespace my-pod -c my-container -- /bin/sh -c "ls /"Print environment variables:
oc exec -n my-namespace my-pod -c my-container -- /bin/sh -c "env"
Collect a JFR dump
JFR capabilities are enabled by default in most JVMs, so you don’t need to pass any special arguments to activate them.
To initiate a JFR recording, you can use the jcmd utility, which allows you to interact with the running JVM process.
Note down the JVM ID which will be used later using jcmd -l command.
# oc exec -n <namespace> <pod> -c <container> -- /bin/sh -c "jcmd -l"
Make sure to embed the commands in double quotes to avoid truncation.

In the above example, 29356 is the JVM ID associated with the application.
When you want to collect a dump on an already running Java application, issue JFR.start with additional flags as required such as dump location, and dump duration.
# oc exec -n <namespace> <pod> -c <container> -- /bin/sh -c "jcmd 29356 JFR.start filename=/home/ag/29356.jfr duration=60s"
Alternatively, the JFR.start command can also take the main class name as the argument, instead of the JVM ID:
# oc exec -n <namespace> <pod> -c <container> -- /bin/sh -c "jcmd Foo JFR.start filename=/home/ag/29356.jfr duration=60s"
Check if the file is being generated.
# oc exec -n <namespace> <pod> -c <container> -- /bin/sh -c "ls -lrt"
The collection stops at the specified duration. If you want to stop in between, issue JFR.stop.
# oc exec -n <namespace> <pod> -c <container> -- /bin/sh -c "jcmd 29356 JFR.stop"
Compress the dump if it is too big.
# oc exec -n <namespace> <pod> -c <container> -- /bin/sh -c "gzip <Name of the JFR recording file>"
Currently, there is no way to limit the size of the dump file. This limitation will be addressed in future releases. In popular application servers like Liberty or Tomcat, recording events for 10 minutes typically results in a dump file smaller than 100 MB.
Transporting the JFR dump
Copy the file to the local system. Use the oc cp command if the size of the JFR dump is less than 2GB.
# oc cp <namespace>/<pod>:/home/ag/29356.jfr.gz ./29356.jfr
Or, you can use oc rsync. Run rsync to copy from the container to local.
# oc rsync <namespace>/<pod>:/home/ag/29356.jfr ./29356.jfr
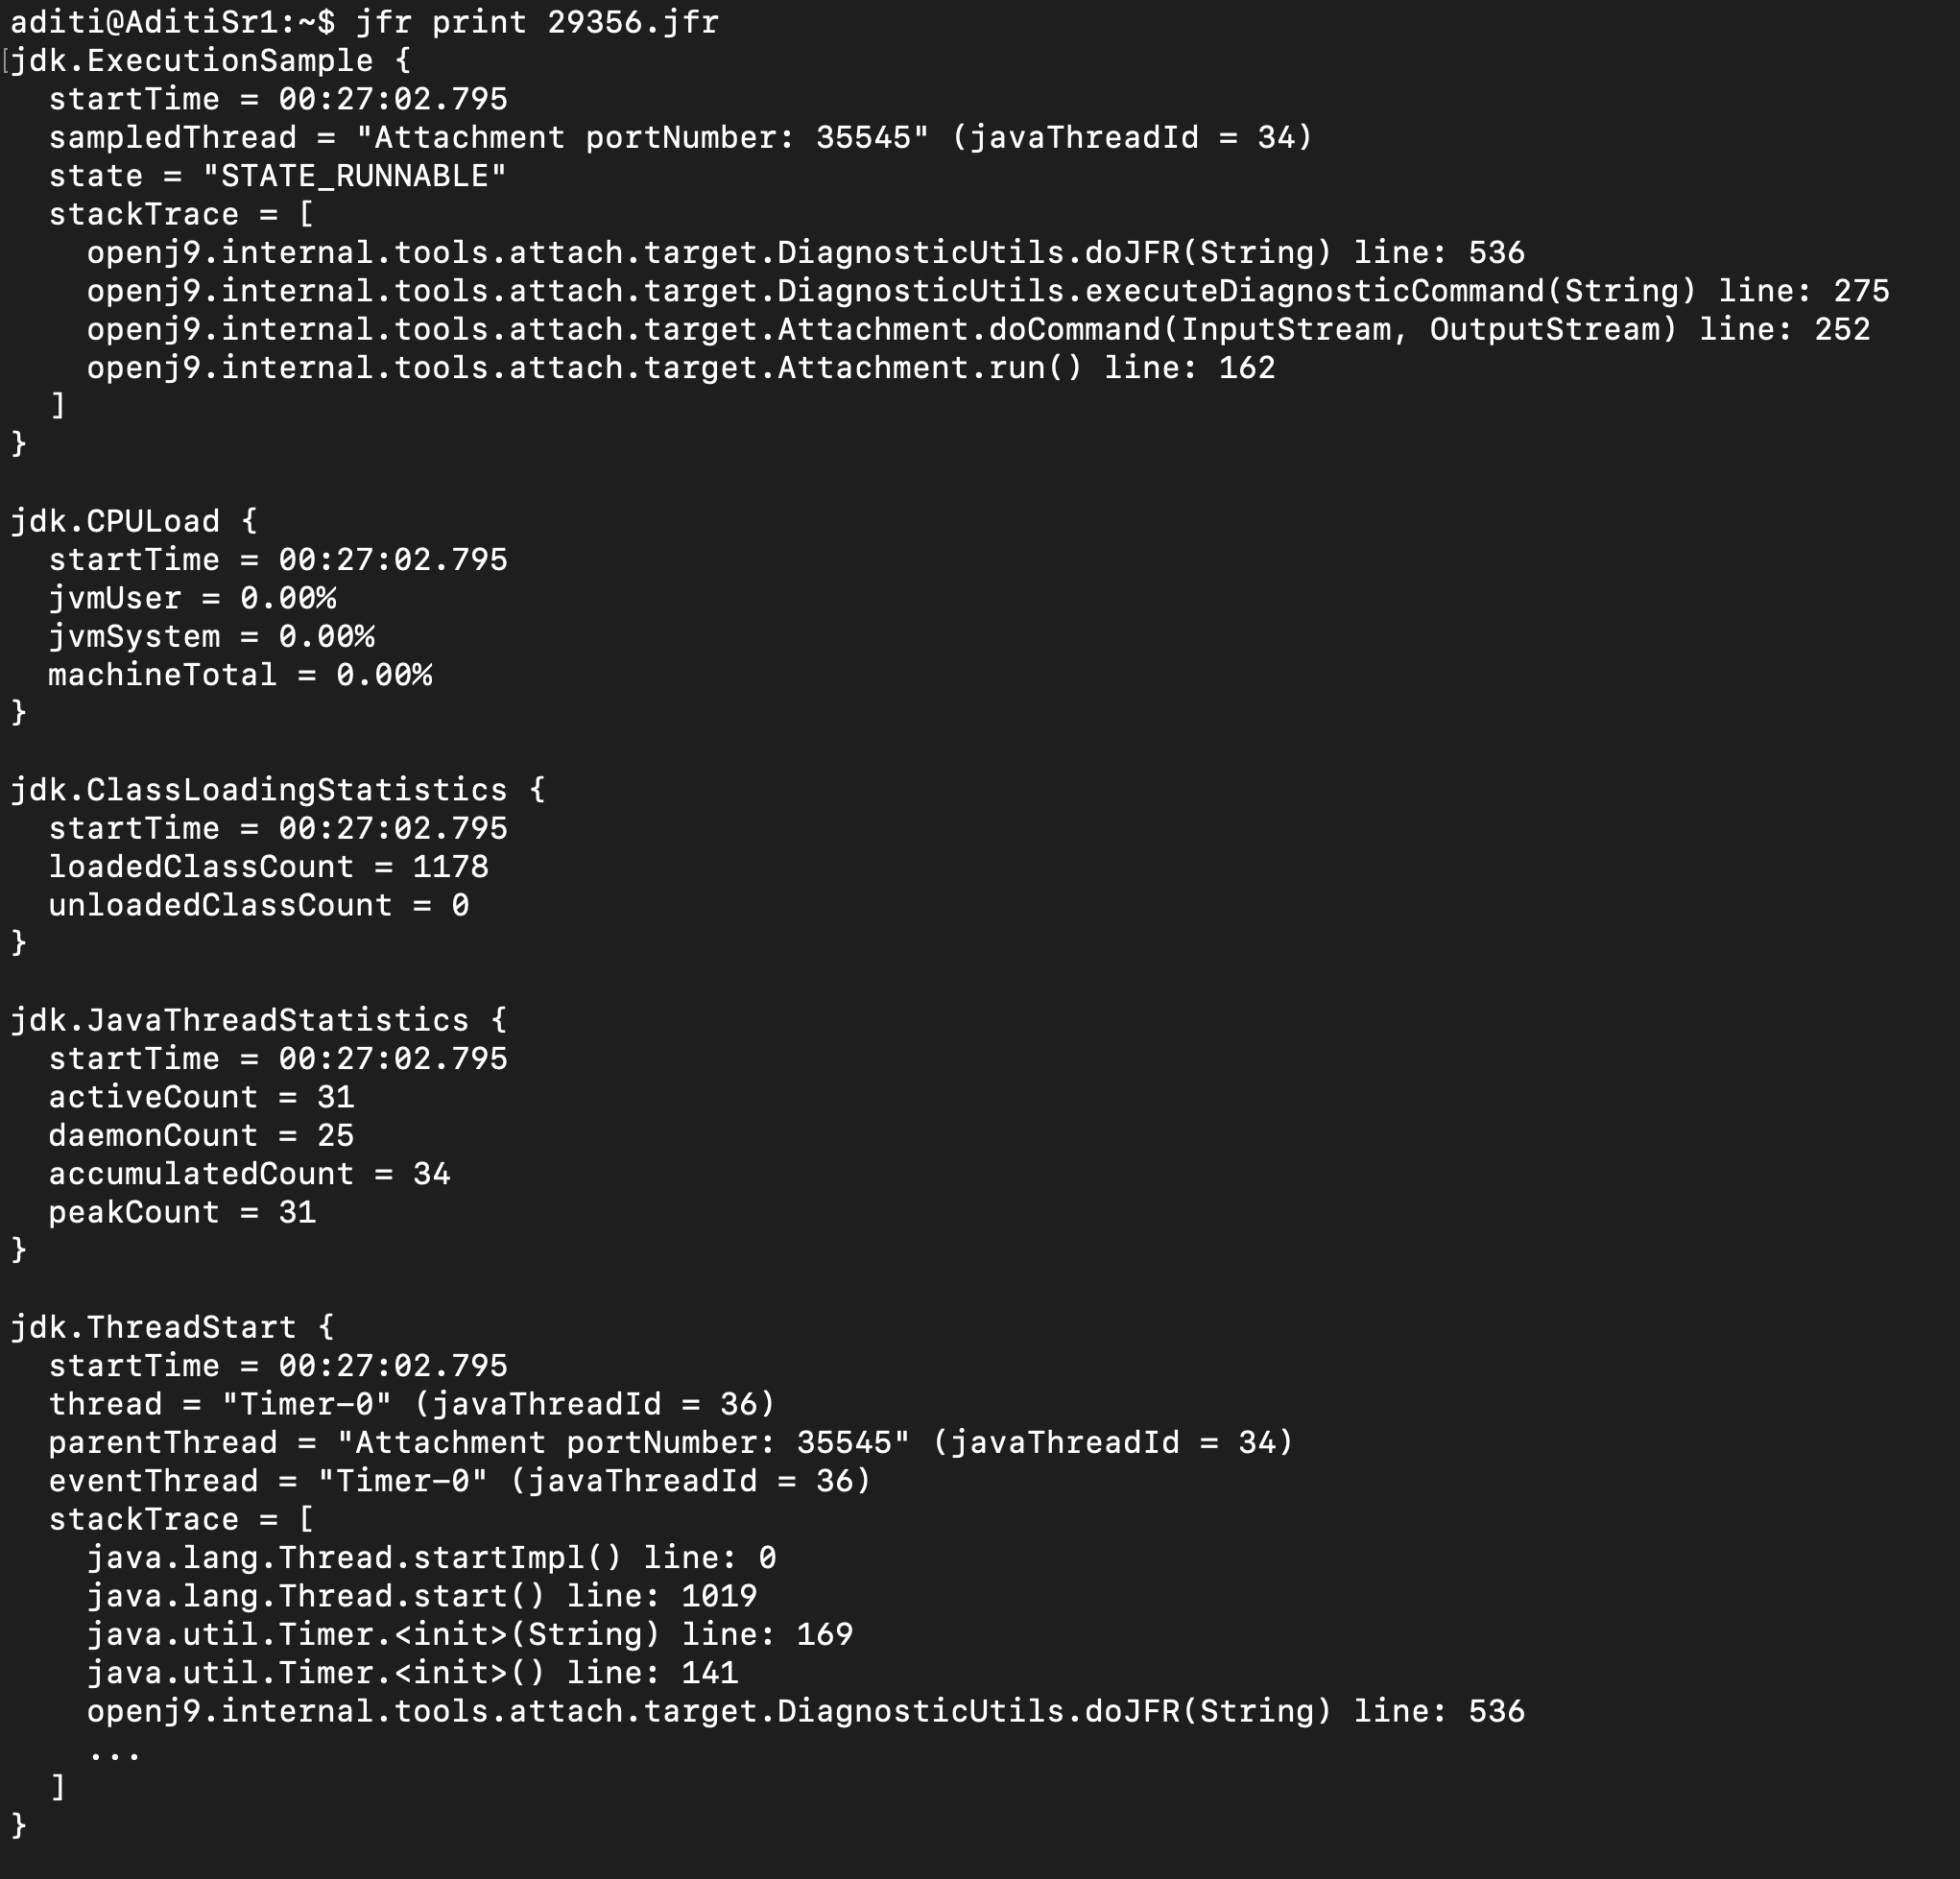
Make sure the JFR dump is in good shape and can be recognized by JMC:
#jfr print 29356.jfr
Use the JFR dump for performance analysis
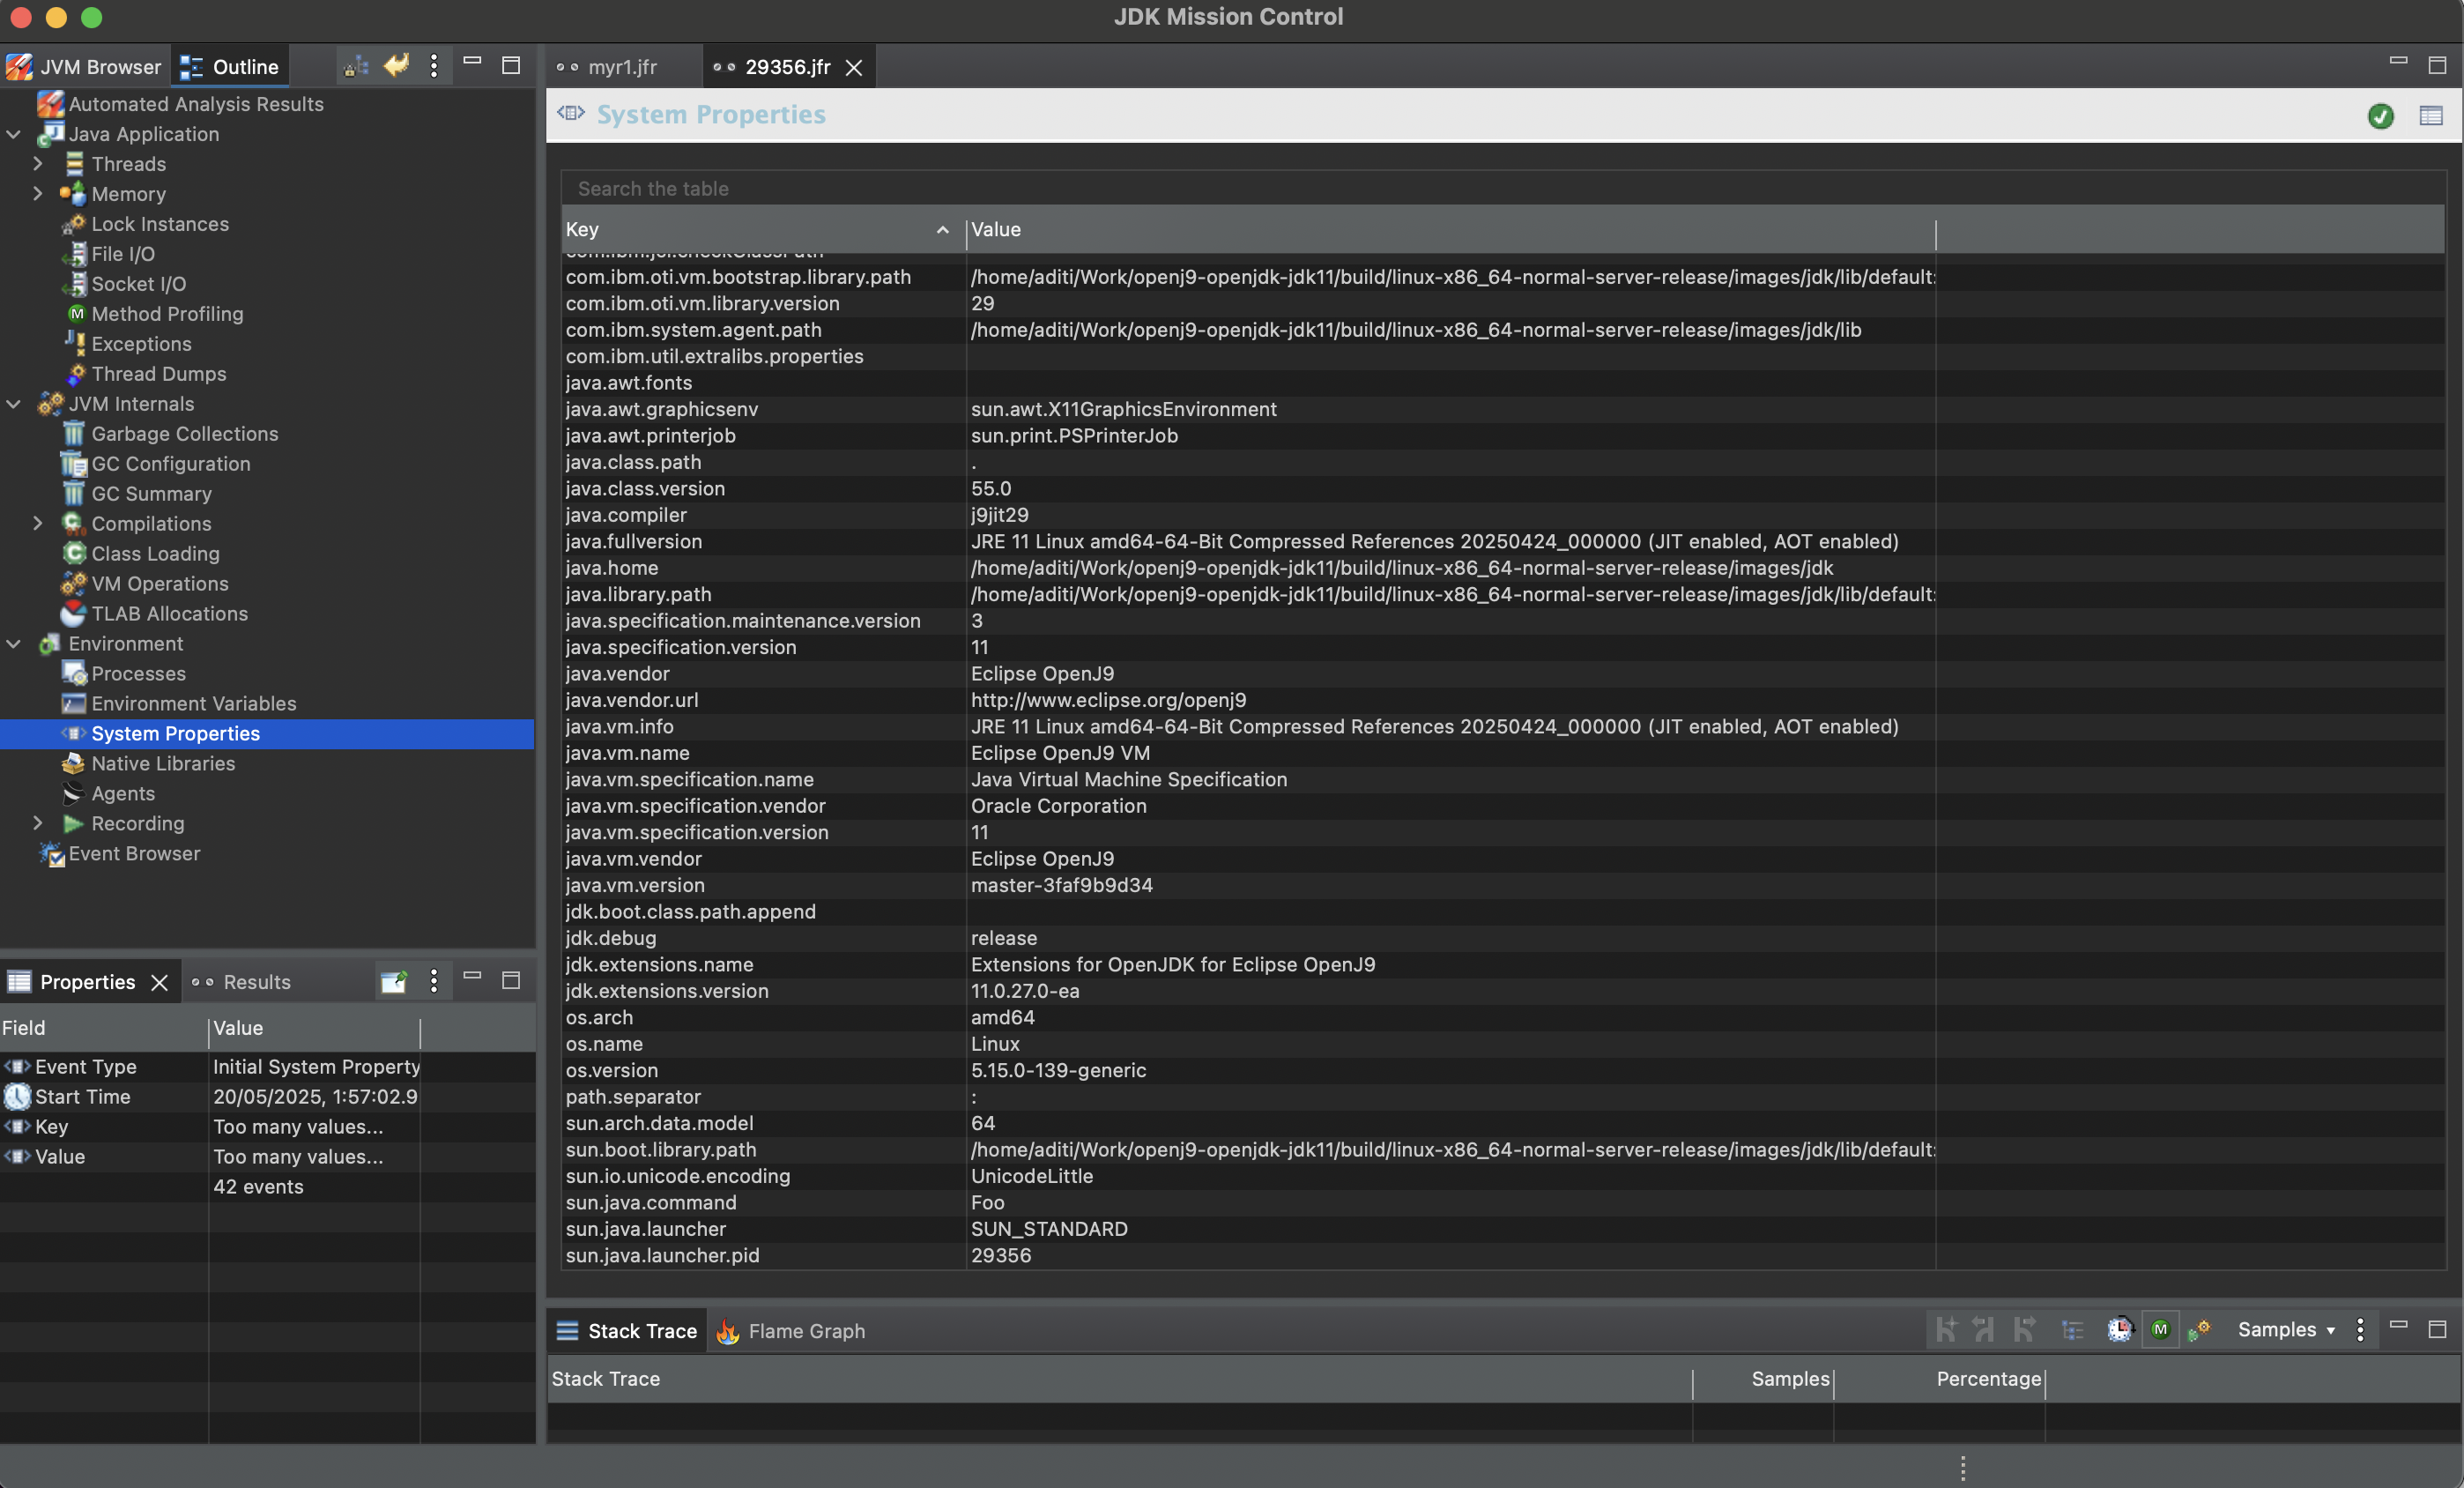
Download and install the latest JMC version (9.x), and load the JFR dump into it to start performance analysis!
Summary
This article walked through the step-by-step process of collecting and exporting Java Flight Recorder (JFR) dumps from a containerized Java application running on Red Hat OpenShift, particularly when SSH access is restricted and persistent storage may not be available.
Key takeways
- Use the
jcmdcommand along with theoc execcommand to start/stop JFR Recordings. - Compress large dumps if needed.
- Export using
oc cp(for <2GB) oroc rsync(for larger files). - Verify the recording with
jfr printand analyze in Java Mission Control (JMC).
Next steps
Review the JFR docs to explore the various commands available for reading and analyzing JFR files.
Download IBM Semeru Runtimes today!