Article
Improve Java startup with Project Leyden
Learn how AOT caching reduces startup and warmup times in OpenJDKModern Java runtimes rely on powerful just-in-time (JIT) compilers to translate bytecode to native machine code at run time. The use of runtime execution profiling supports feedback-directed optimization and speculative optimization. Both of these strategies allow Java JIT compilers to achieve peak performance that far exceeds what can be achieved with programs that are compiled ahead-of-time (AOT).
When a new Java application is launched, it is a cold start. The Java virtual machine (JVM) has to parse and unwrap bytecode, construct its own metadata model of the classes, initialize them, and then link calls and data accesses.
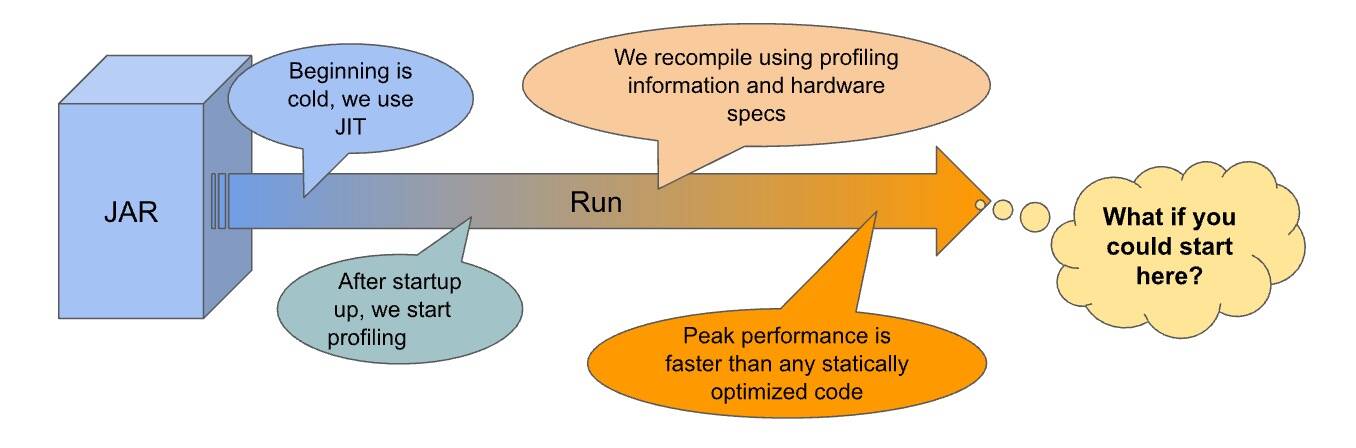
The JVM normally starts off executing Java methods in the interpreter. After gathering some runtime information, it starts compiling code to native. But compilation takes time to complete so it is normally better done in the background while proceeding to interpret.
After some time, a steady state is reached where most or all classes are loaded and linked, most or all methods have been profiled, and all ‘hot’ methods have been compiled with highly efficient code.
On every run, a lot of the same bytecode gets loaded and linked, the same classes get initialized, the same methods turn out to be hot, and end up getting compiled with the same or very similar profile information. Project Leyden explores the idea of caching the runtime information to speed up startup on subsequent runs.
Training and Production Runs
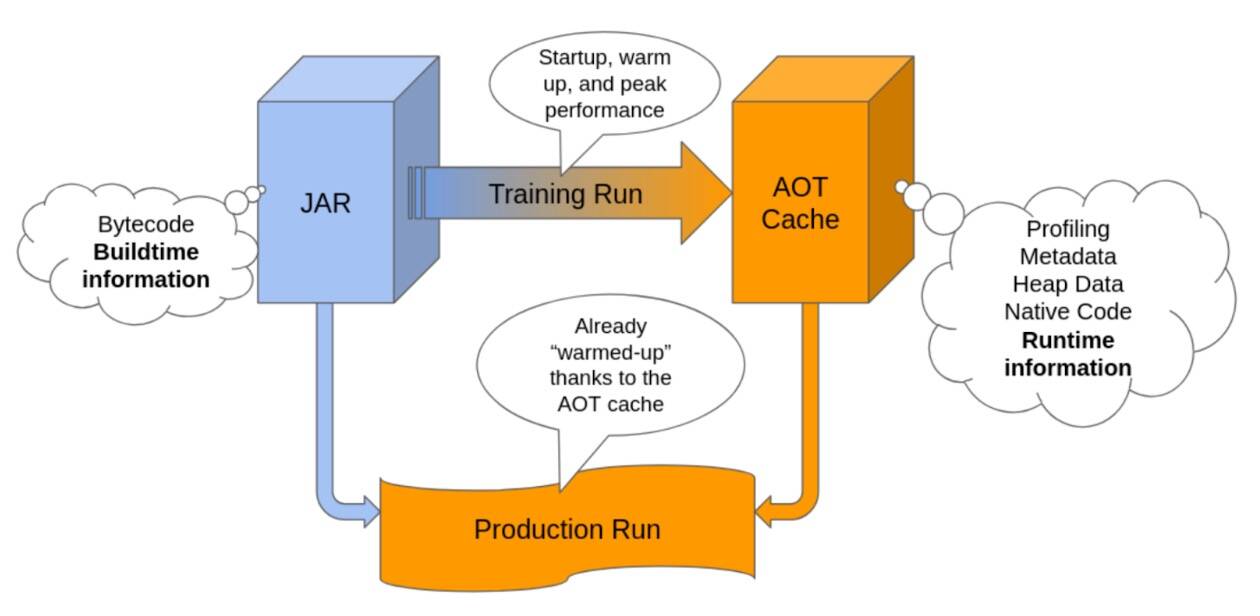
The basic idea behind Project Leyden is to run your application twice:
- Training Run: In this run, the JVM caches the metadata, the profiling statistics, some heap data, compiled code, and so on.
- Production Run: In this run, the JVM loads the previously (ahead of time) cached information, so the run starts hot. This is the “real” run in which we make use of our app.
To use an AOT cache (on JDK 25+), you need to add some JVM arguments to your app launch command:
- Training Run:
java -jar app.jar -XX:AOTCacheOutput=${aot-cache-file} - Production Run:
java -jar app.jar -XX:AOTCache=${aot-cache-file}
How to properly execute the training run?
The best way to train your application and generate the AOT cache is a canary deployment, where you run your application in the real production environment with training enabled, allowing it to collect training data as it runs. However, that’s not always feasible, especially on containerized production environments that don’t have disk-write privileges.
If you have a strong testing framework, and you are using Quarkus, you can always generate the AOT cache using integration tests.
The best results arise when the training run resembles a production run as closely as possible. However, whatever training method you employ, any cache produced will only be usable in production if you run with the same JVM and the same command line JVM options.
Should I start using the AOT cache?
The short answer is yes.
Let’s see an example. We are going to use a simple REST API application using Quarkus that connects to a database to extract data. We use a single training run with 10 000 requests, executing a test that calls the endpoint /fruits repeatedly.
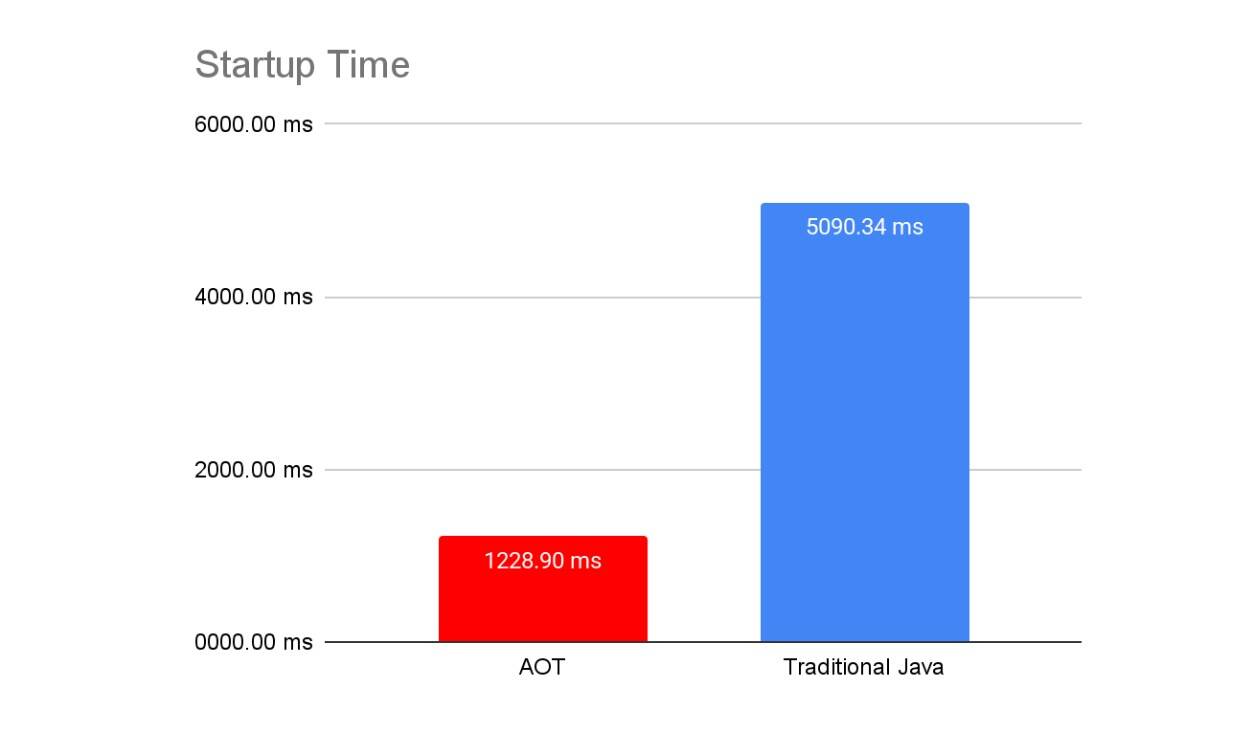
Startup time gets drastically reduced when using the AOT cache:
Now, let’s take a look at the response times and see if the warmup time is also improved:
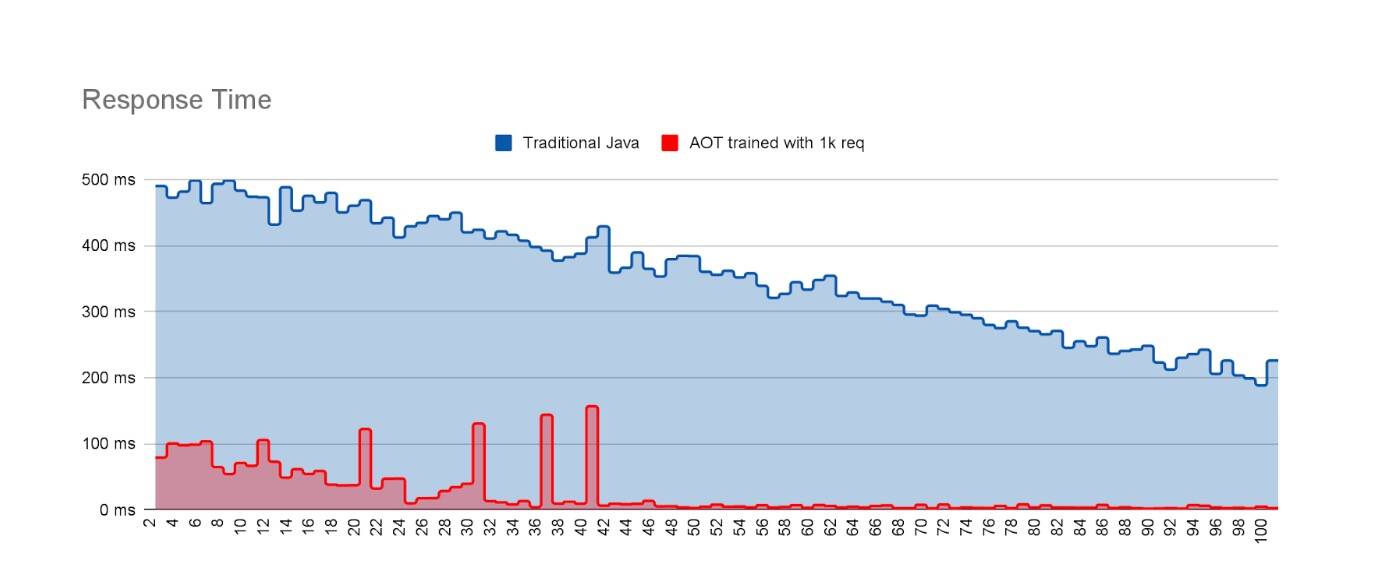
The x-axis in the previous image shows the request number, not time.
Both runs suffer jitter during the first requests while the JVM does some initialization, at which point most of the housekeeping work is completed. The dramatic drop off in jitter for the AOT run around request 45 indicates that at this point almost all loading, initialization and linking costs have been met and the necessary compiled code has been delivered. By contrast the non-AOT run is still suffering jitter even after 100 requests (that is, it has still not warmed up to reach peak performance).
How do I know if Leyden is helping?
Depending on how well you train your deployment, you might see different improvements in time to reach application start (startup time) and time to reach peak performance (warmup time). However, simply measuring these two times doesn’t help with the problem of explaining why, for some given training regime, you get a specific improvement or perhaps, in some cases, no measurable improvement.
To explore what is inside the AOT Cache and get hints on how to improve your training, you can use the AOT Analyzer Tool. It allows you to explore how well your methods have been trained and what are the contents of the cache.
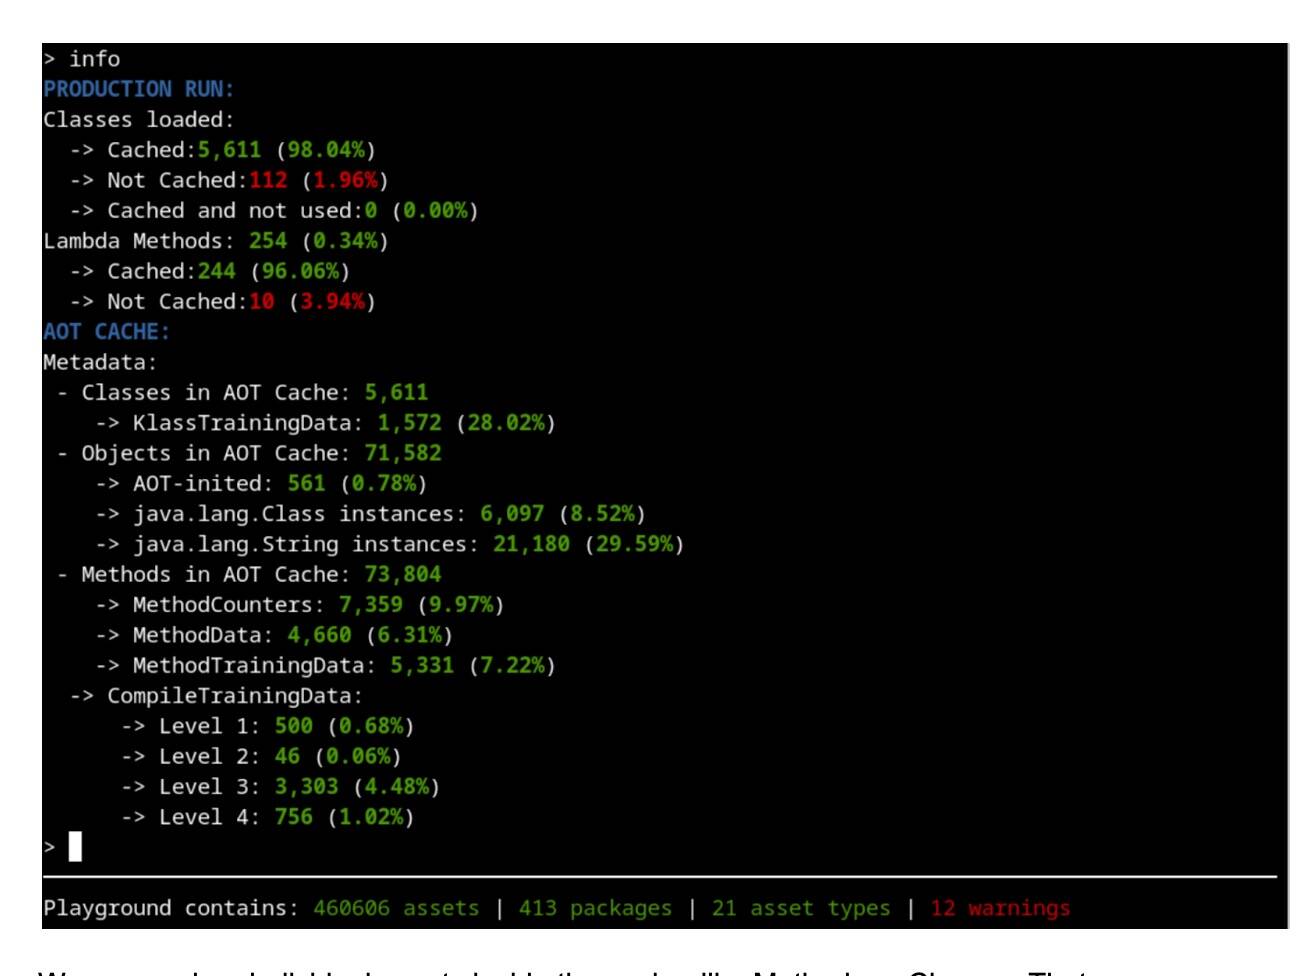
The info command shows a summary of what is inside the cache and some percentages to help understand how accurately the training run represents the training run.
We can explore individual assets inside the cache, like methods or classes. That way we can discover if they were stored, if there’s any issue regarding them, if they are properly trained, and so on. This can help us discover if our training run needs to be tweaked to improve the generated cache.
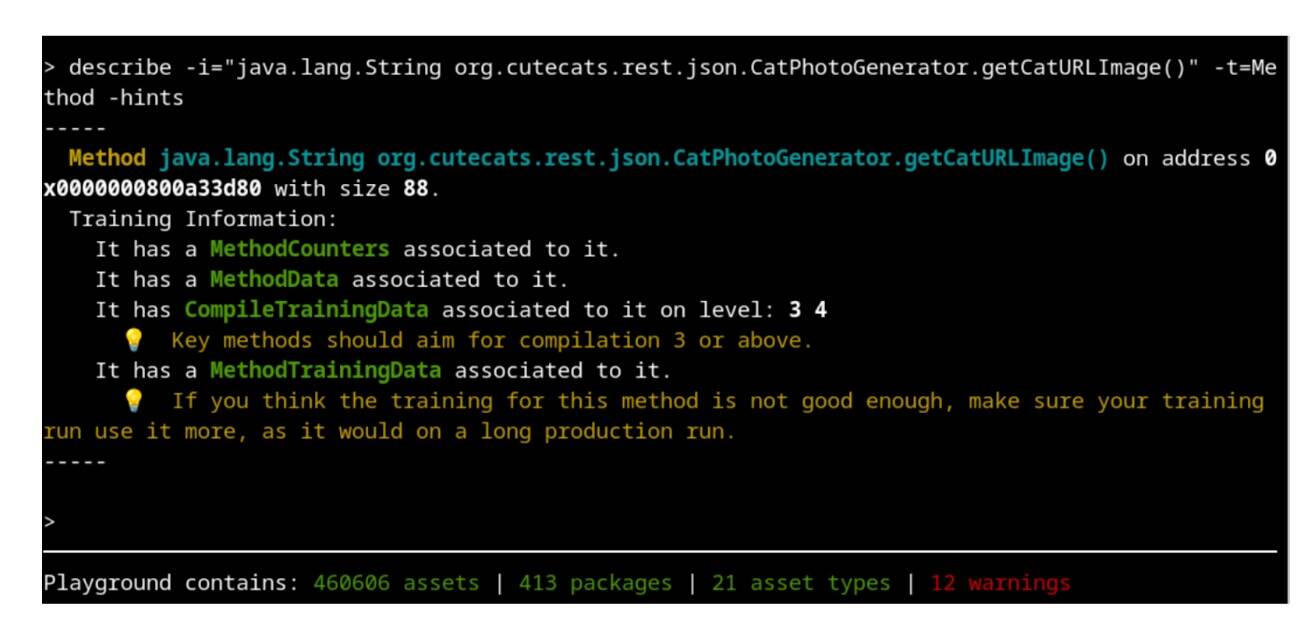
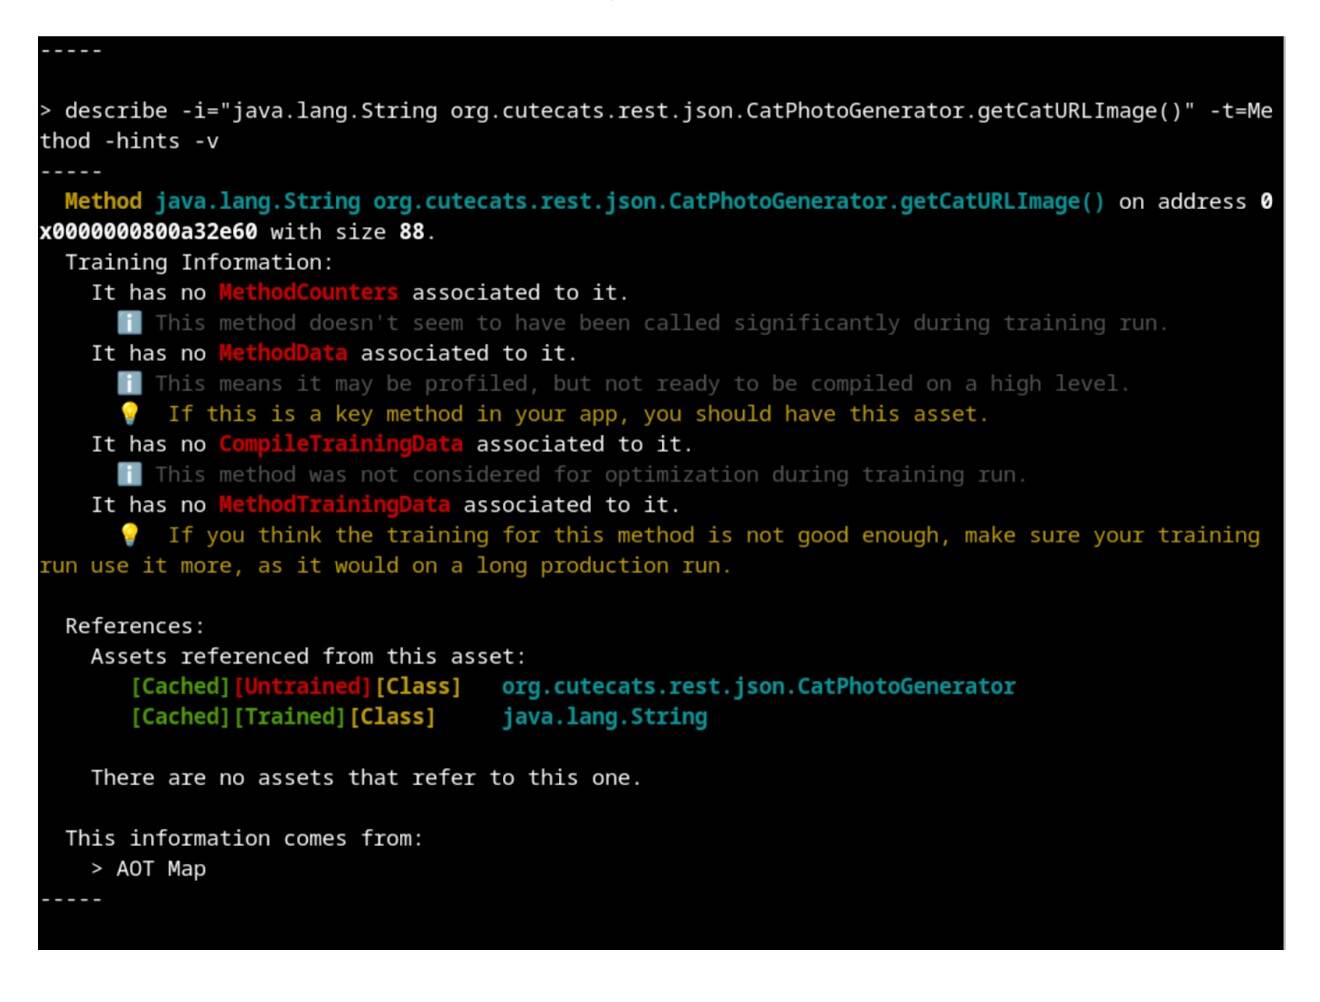
We can make use of the -hints and the -v argument to get an idea of what each element means and what can be done to improve the training run.
Summary
Using the AOT Cache from Project Leyden on your CI/CD should be a simple step that can bring great performance advantages already. Also, by using it now, you will be ready when future versions of the JDK include more assets into the cache to speed up startup and warmup even further.
You can learn more about how the AOT cache works and how to use it in the How is Leyden improving Java Performance blog series.