About cookies on this site Our websites require some cookies to function properly (required). In addition, other cookies may be used with your consent to analyze site usage, improve the user experience and for advertising. For more information, please review your options. By visiting our website, you agree to our processing of information as described in IBM’sprivacy statement. To provide a smooth navigation, your cookie preferences will be shared across the IBM web domains listed here.
Tutorial
Enable concurrent code coverage while debugging COBOL program source
Learn how to enable code coverage and debug source code within IBM Developer for zSystems, generating a code coverage report at the end of the session
On this page
Archived content
Archive date: 2024-05-31
This content is no longer being updated or maintained. The content is provided “as is.” Given the rapid evolution of technology, some content, steps, or illustrations may have changed.This tutorial shows you how to enable concurrent code coverage in your debug sessions, which allows you to do code coverage in parallel with debugging rather than separately. It also provides a visual indicator of which lines of operational code have been run during the debug process.
Prerequisites
To take advantage of this feature, you need:
- IBM Developer for zSystems (IDz) software, installed at version 15.0.3 or later, and configured with a connection to a Multiple Virtual Storage (MVS) logical partition (LPAR)
- Basic understanding of IDz navigation concepts, including the context menu (check out our no-charge IDz Remote Training options)
- Access to the IBM Debug Tool
- Debug-ready load module and pre-configured debug JCL
Estimated time
Submitting the debug JCL, completing the debug session, and reviewing the code coverage report should take about 10 minutes.
Steps
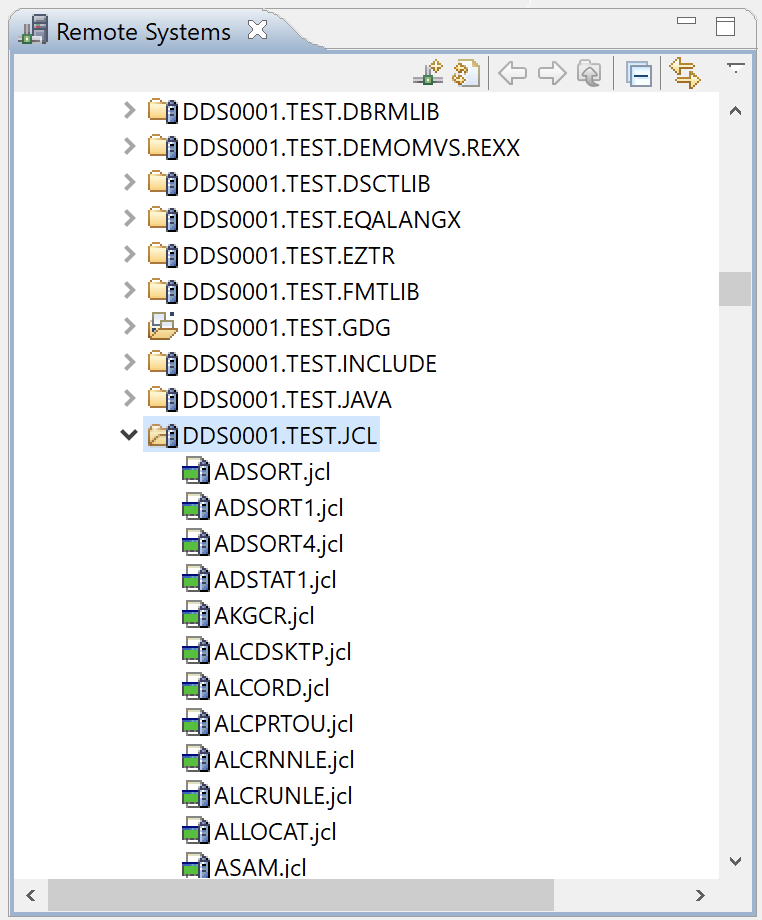
Navigate to the JCL library that contains your pre-configured debug JCL.
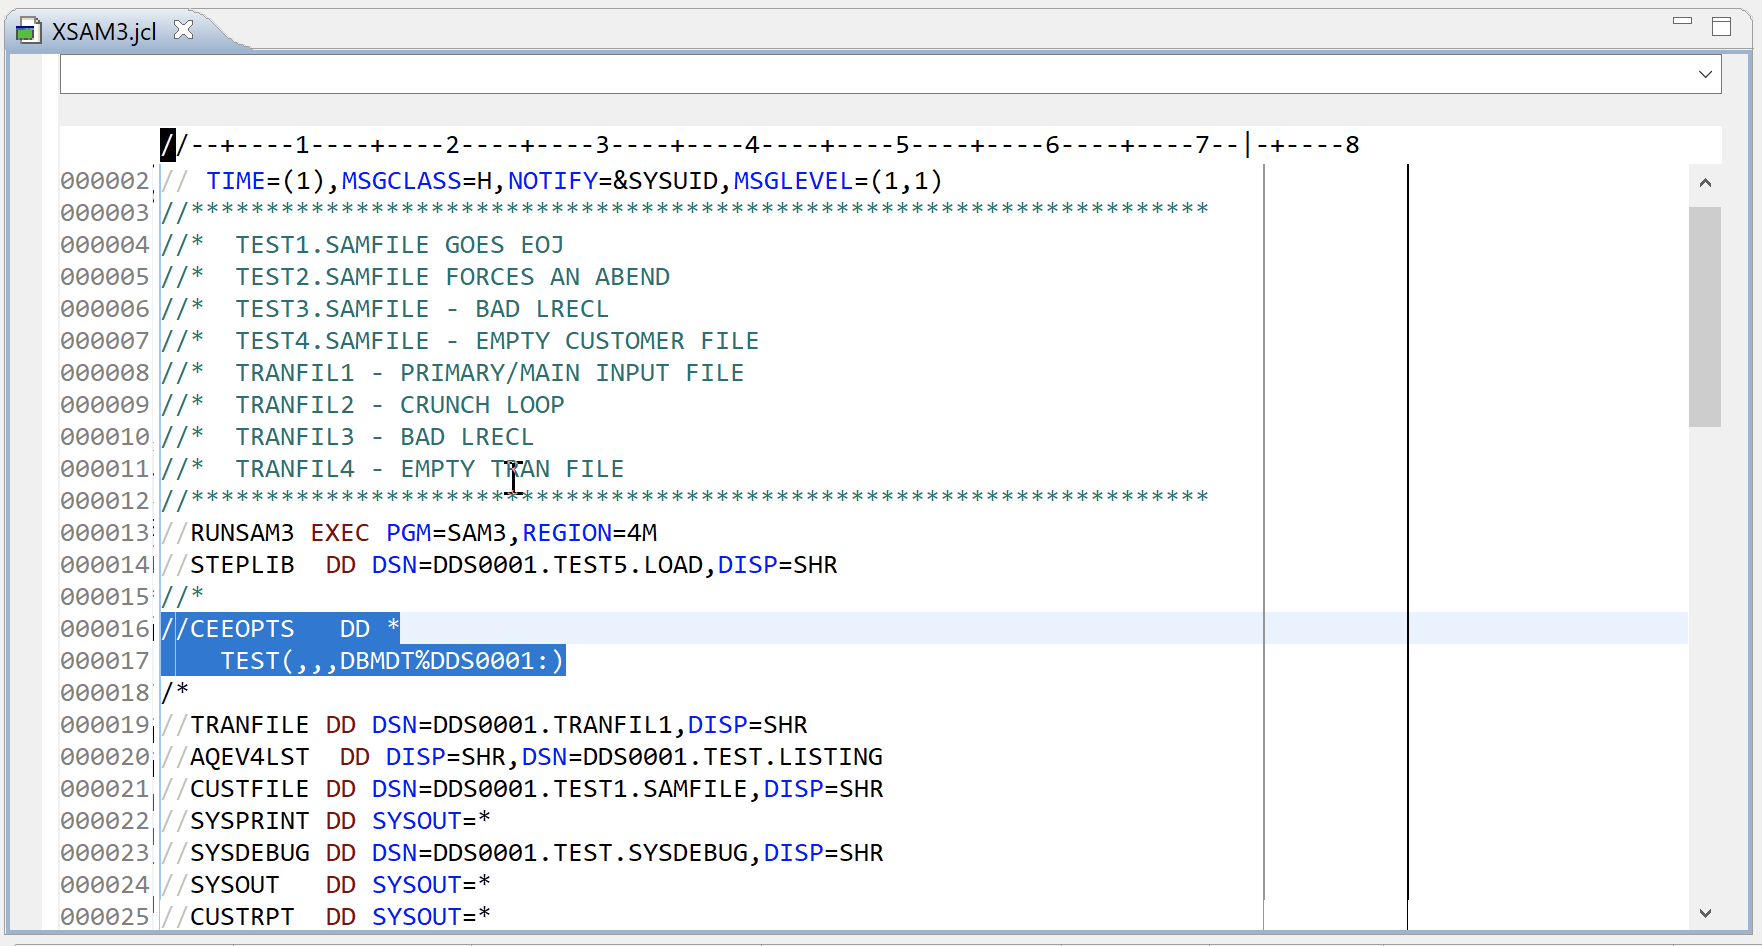
Locate and open your debug JCL member, locate the test DD statement, and verify that the parameters within are correct. This might include checking your IP address if you are using the hard-coded IP parm, or verifying that your TSO ID is correct if you're using the DBMDT parm.
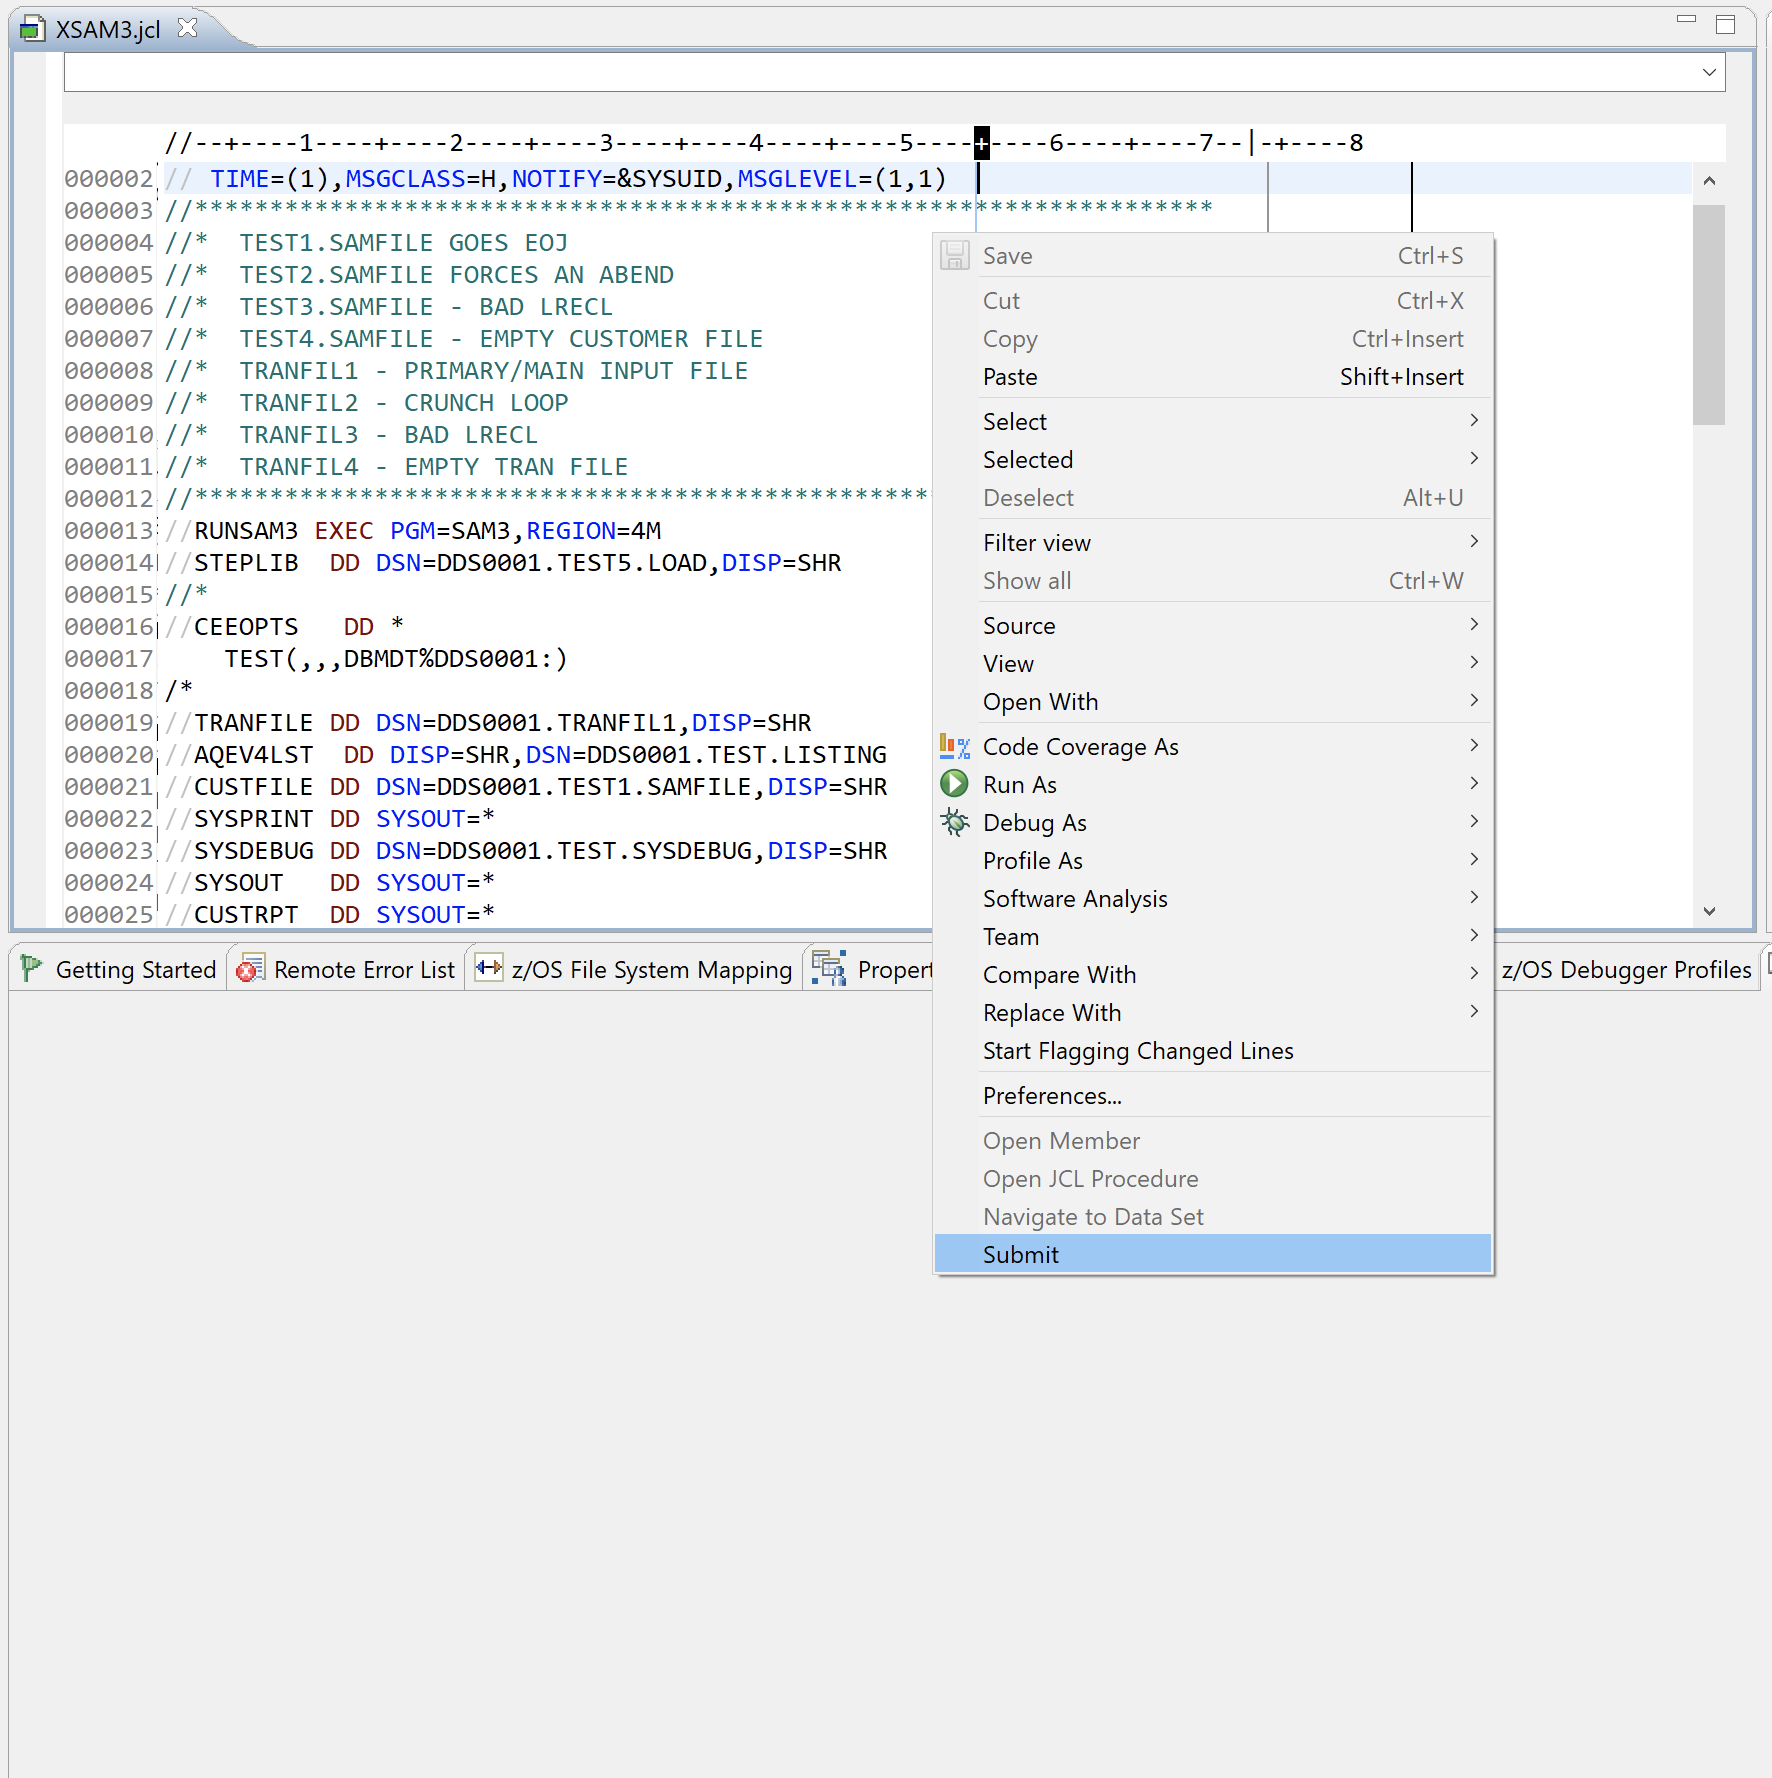
Once that's confirmed, submit the JCL to the host system by right-clicking inside the JCL, then choosing Submit.
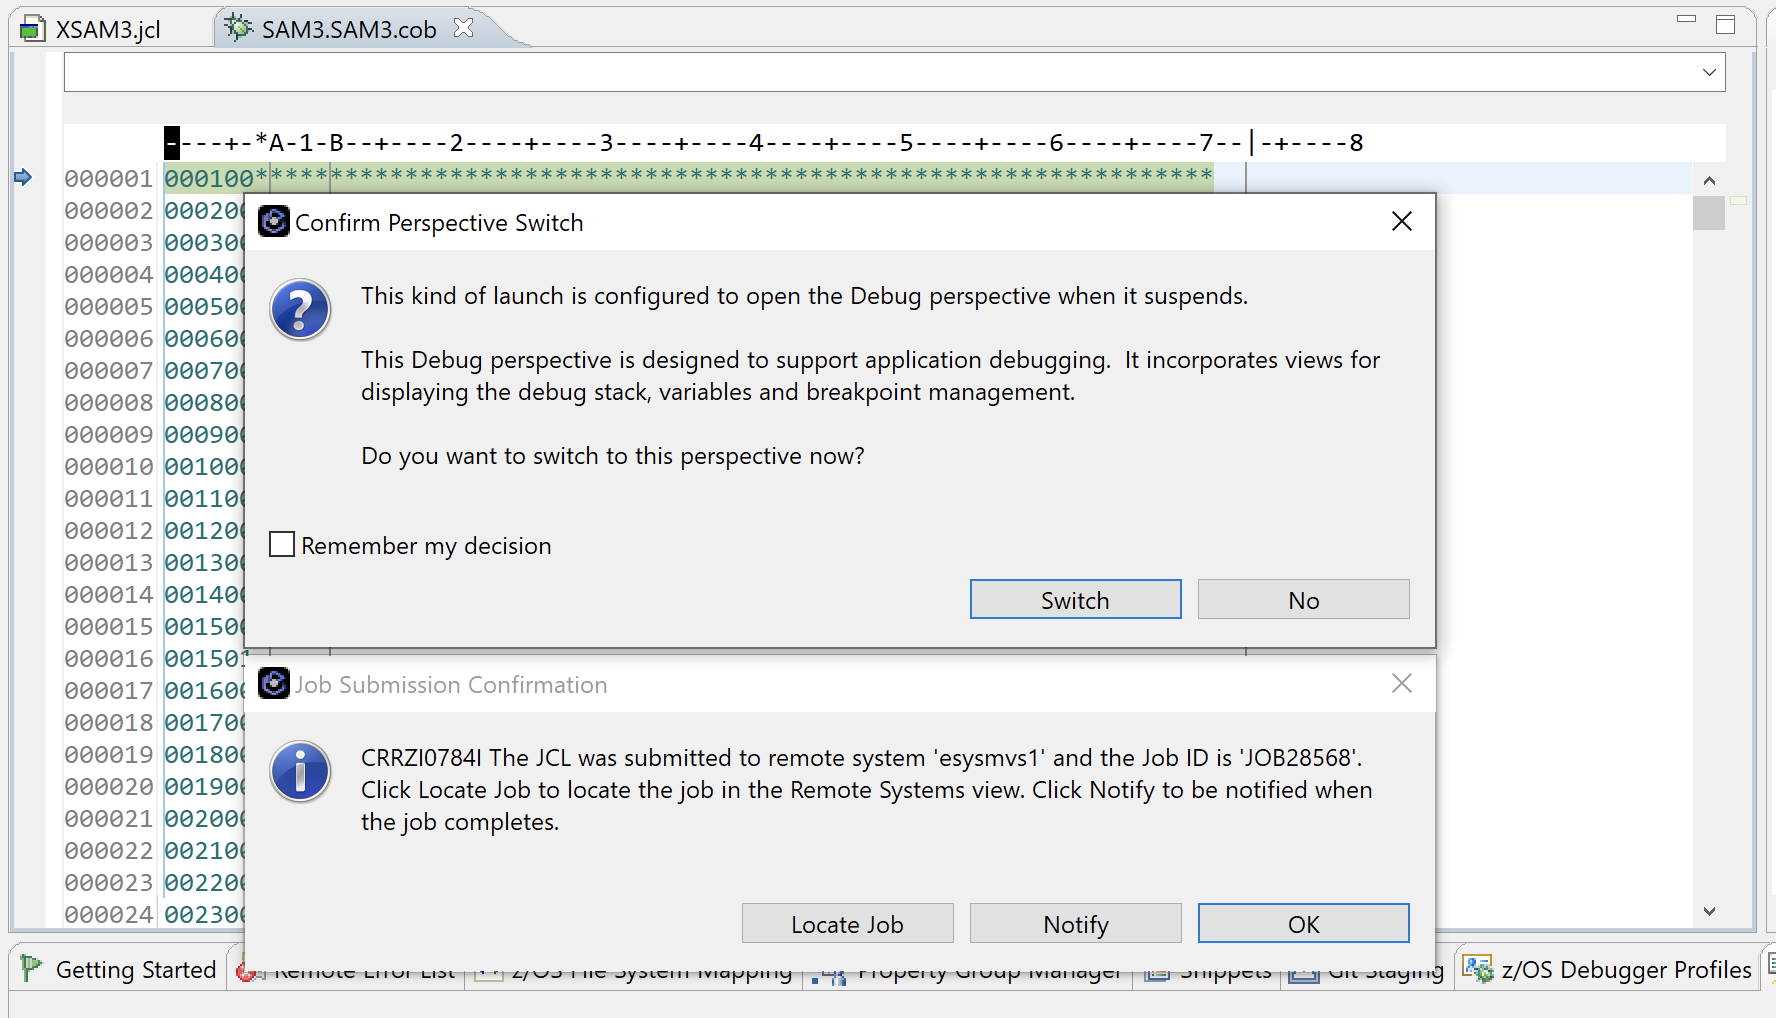
After you click Submit, two dialog boxes should appear. Click Switch in the Confirm Perspective Switch dialog box, and click OK in the Job Submission Confirmation dialog box.
The workbench will enter the Debug perspective. This perspective contains views, or tabbed and resizable windows, that display information around or provide access to different facets of MVS debugging activities.
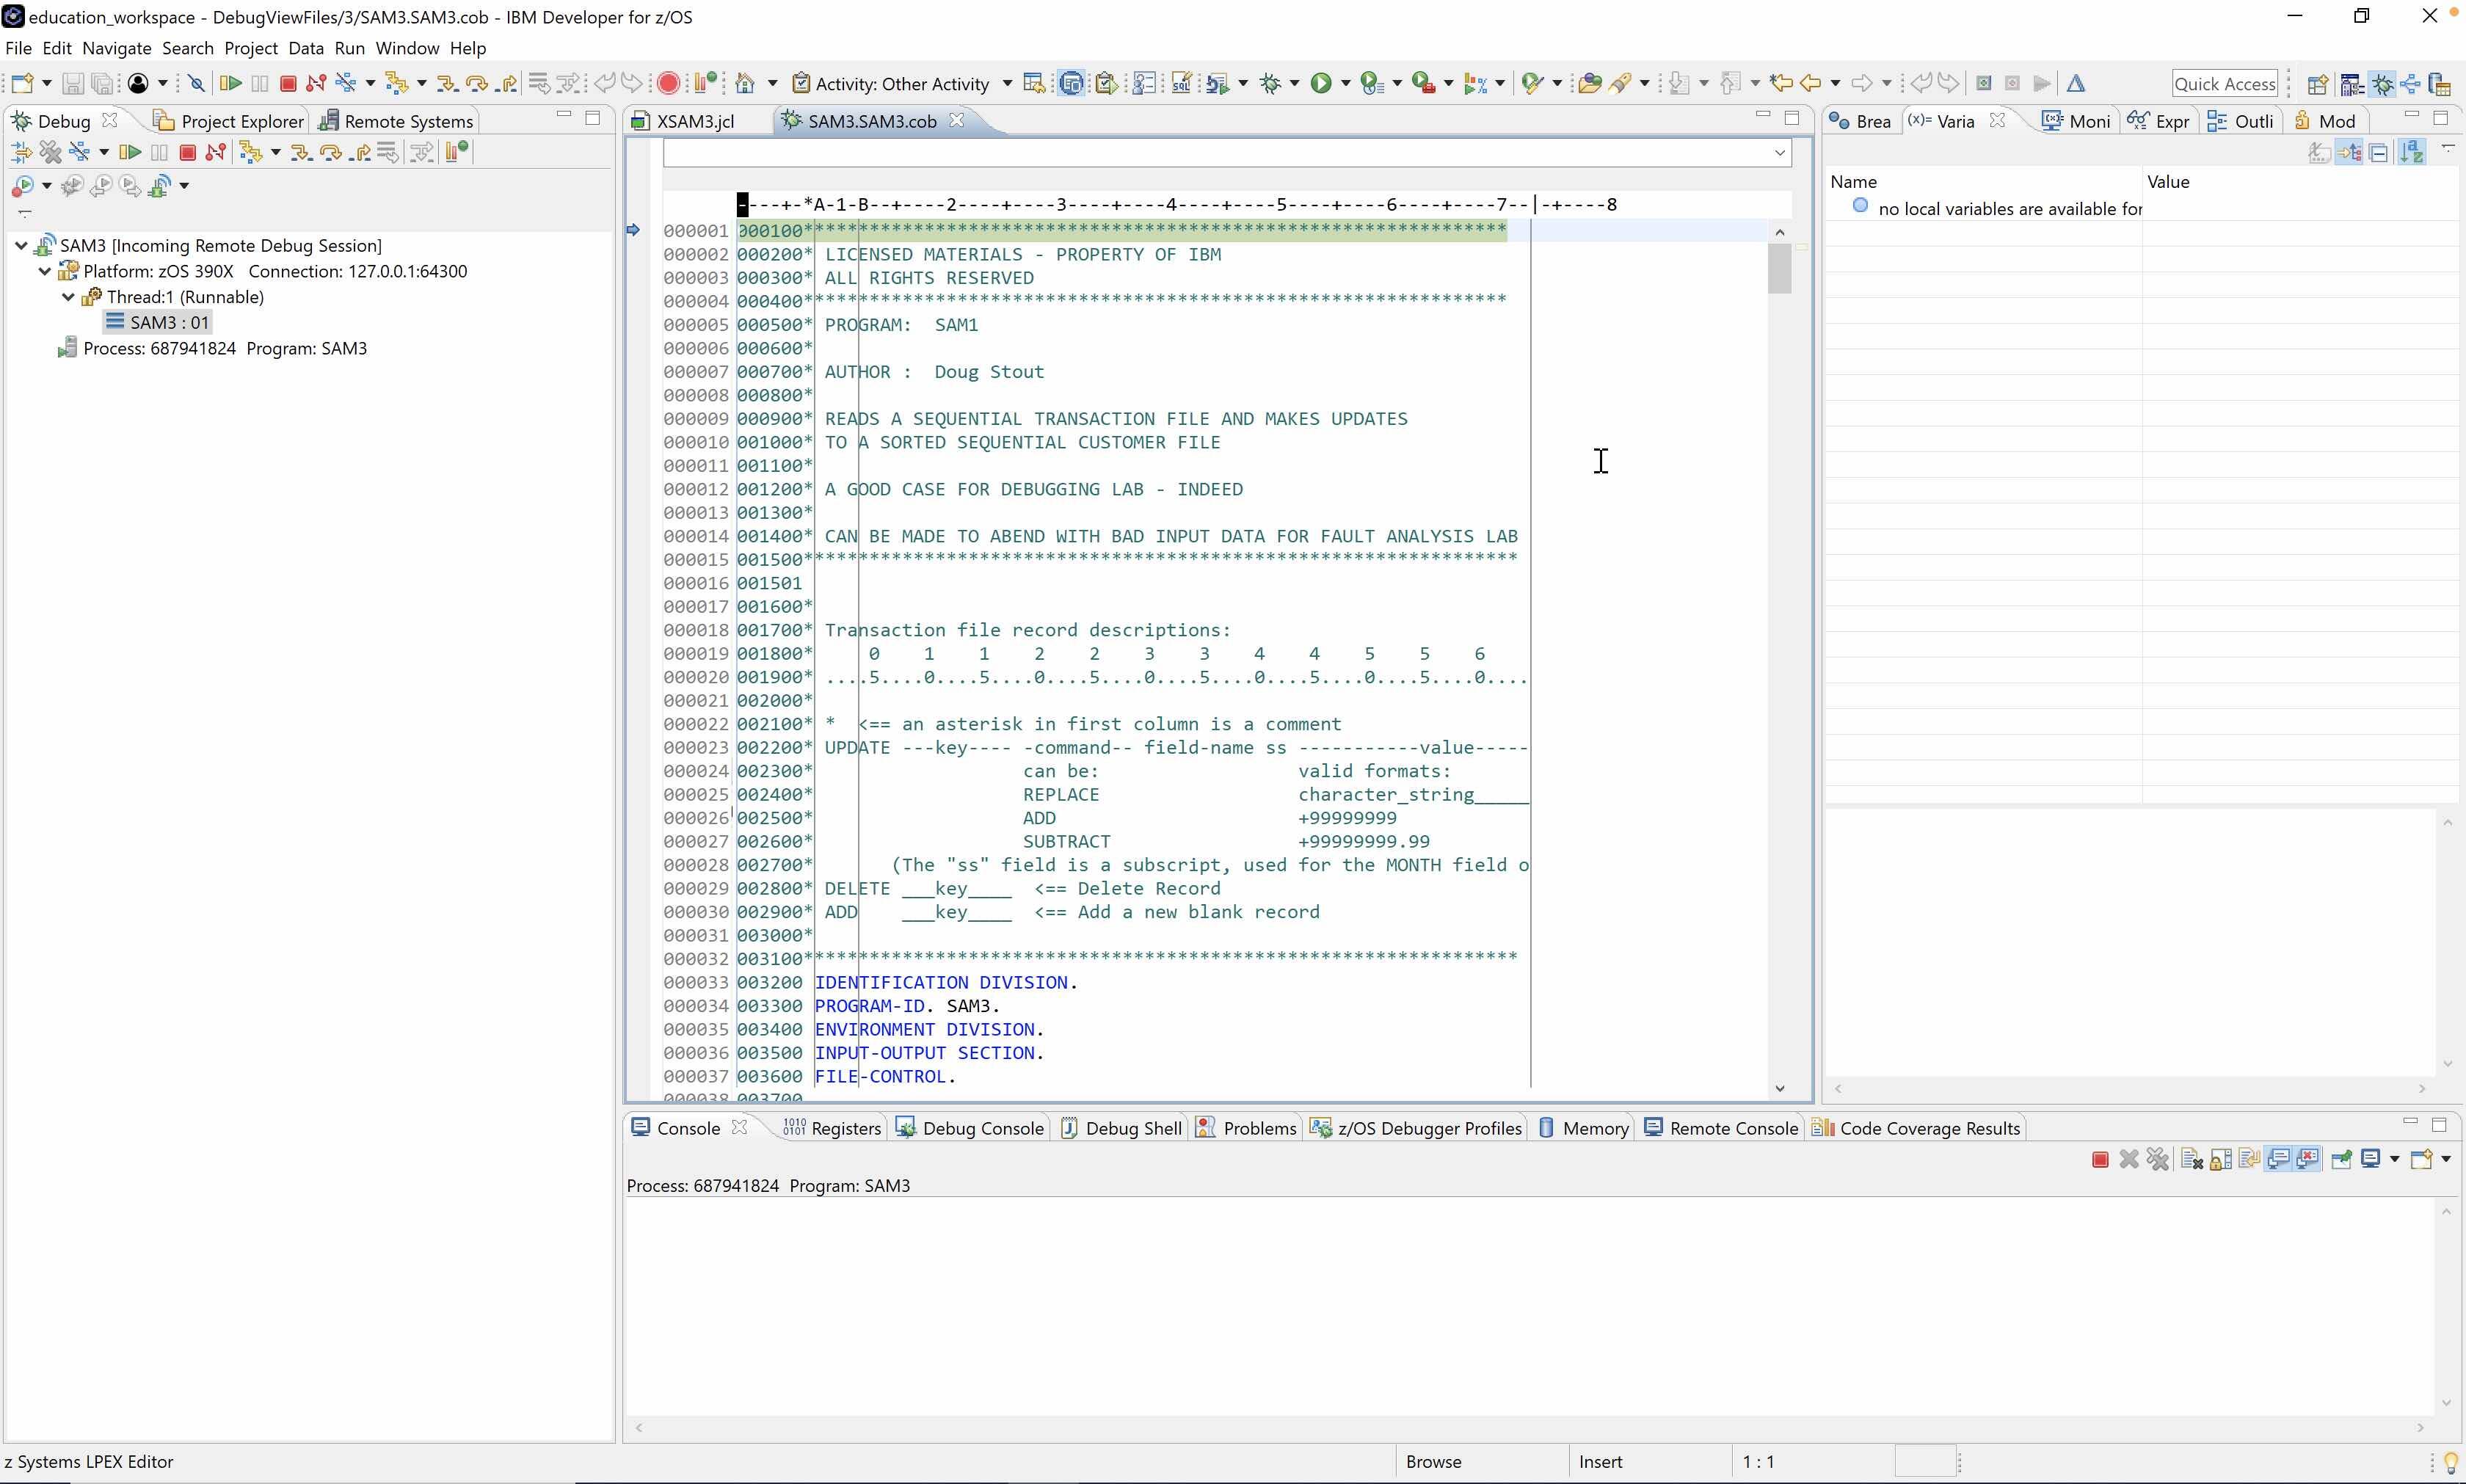
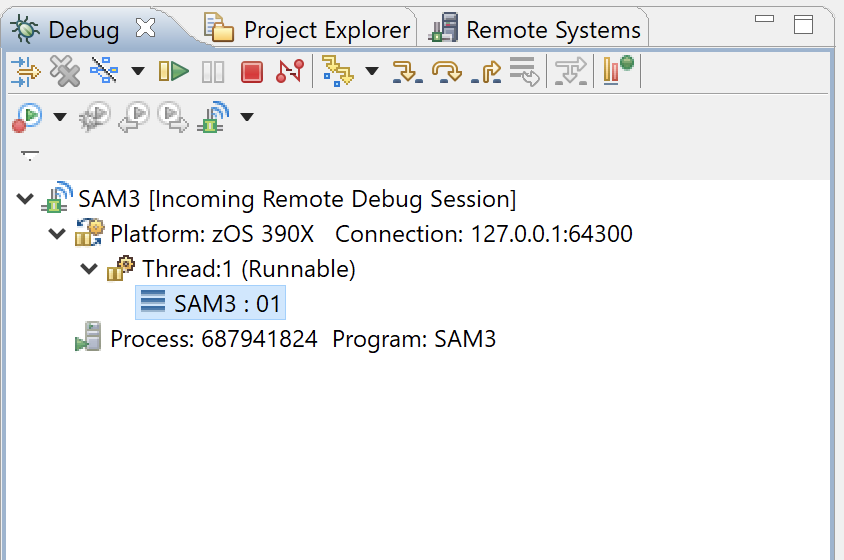
From the Debug perspective, navigate to the Debug view. By default, this view is in the upper-left corner of the perspective.
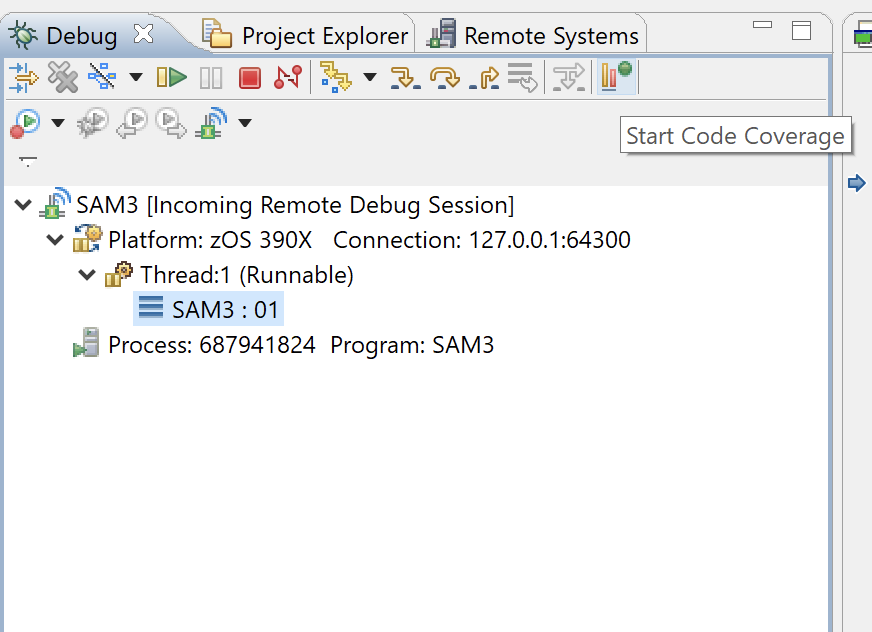
Inside this view, navigate to the toolbar at the top of the view. On the toolbar, locate the toolbar icon for Start Code Coverage and click to toggle it on. This starts the concurrent code coverage run.
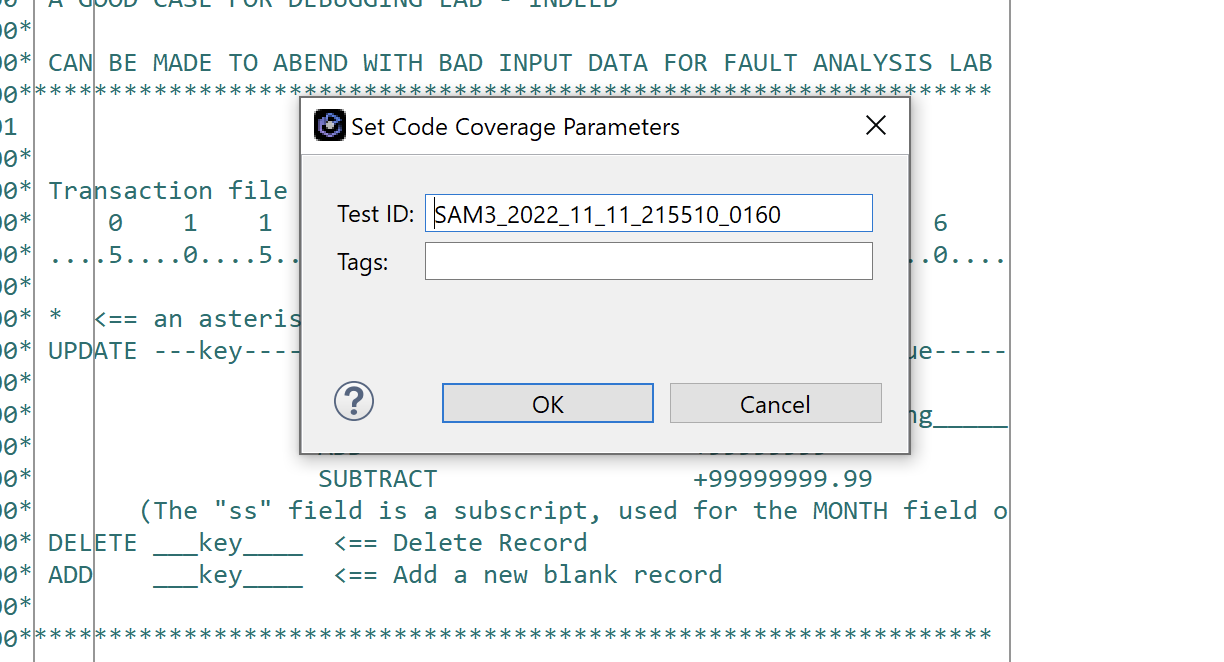
When that's toggled on, a Set Code Coverage Parameters dialog should pop up, allowing you to specify a test ID and any tags you want to associate with your code coverage run. You should see an auto-generated test ID already filled in. Click OK.
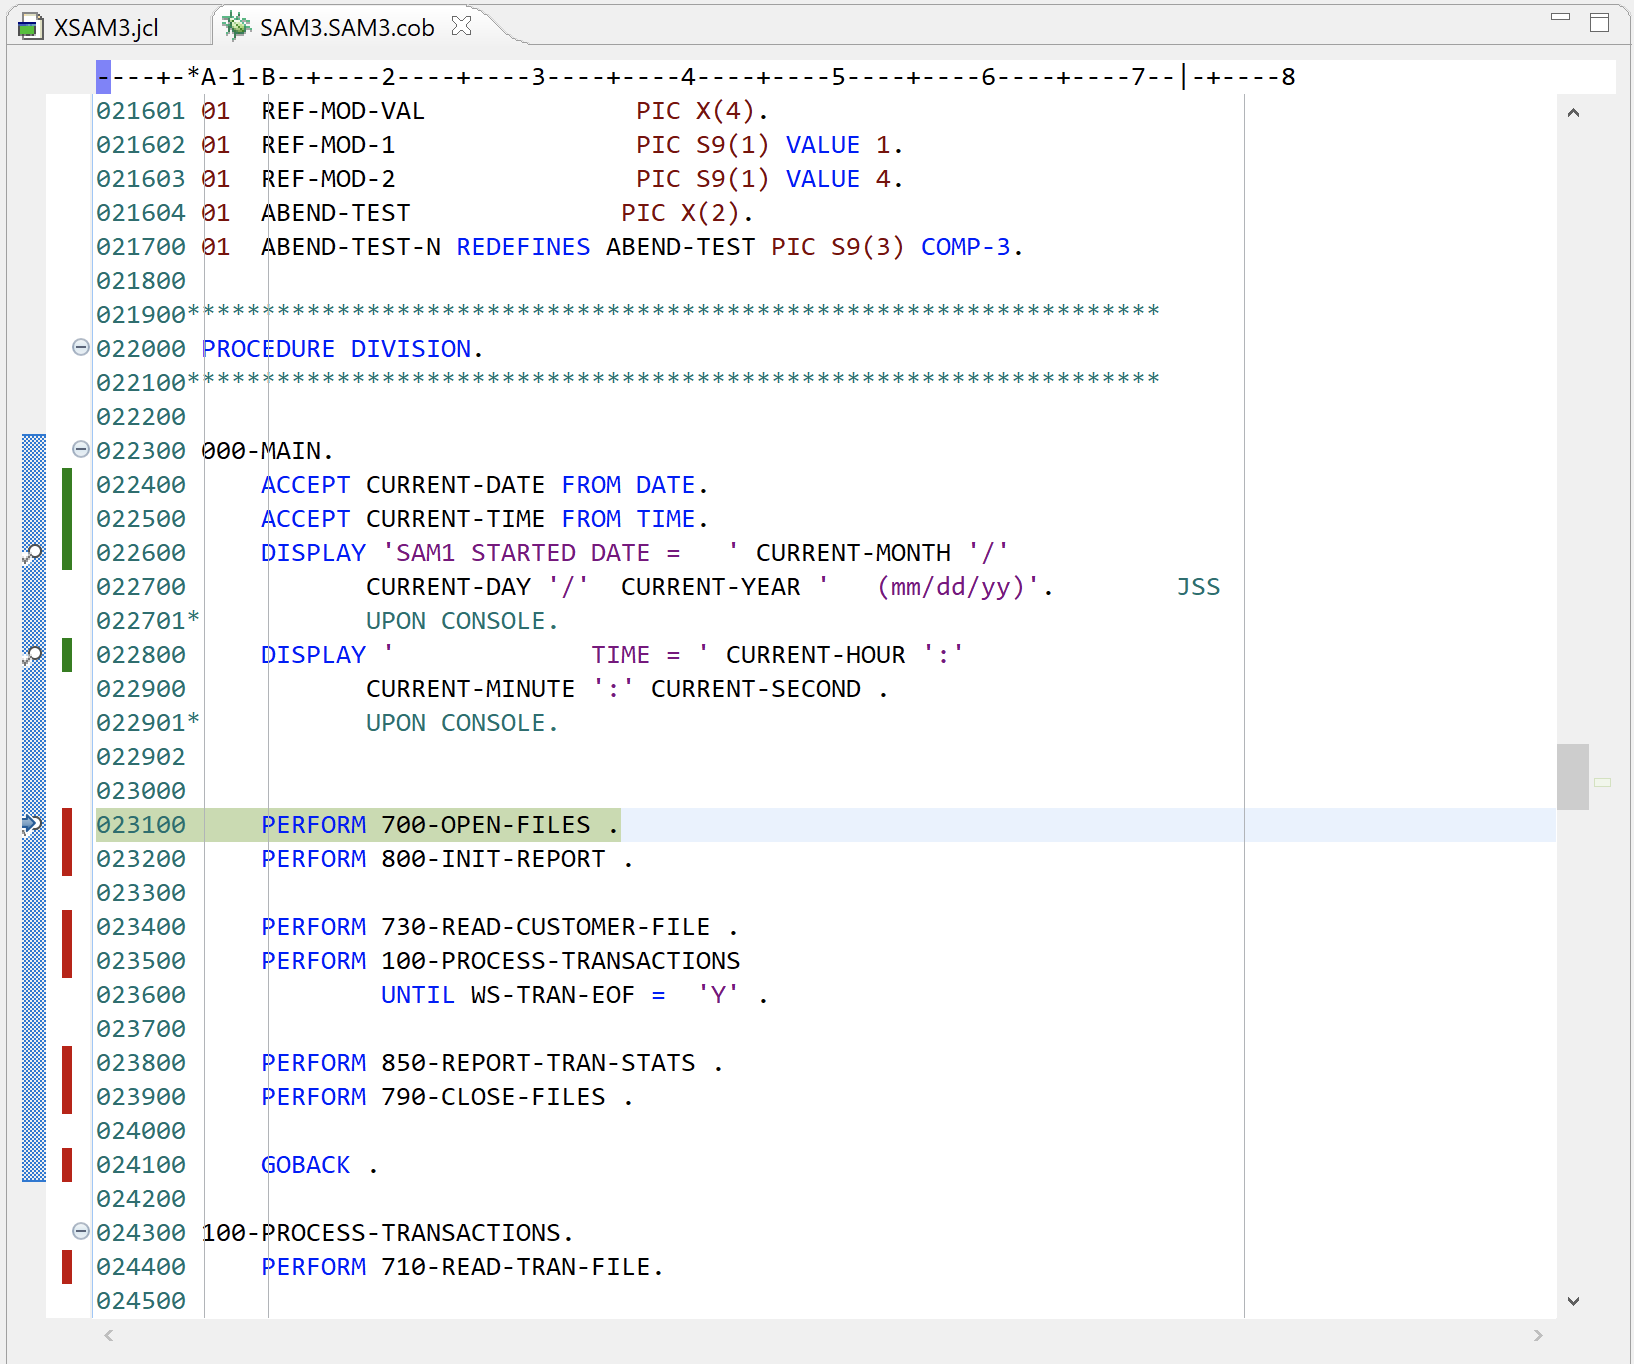
After you have started the concurrent code coverage feature and made any changes to the Set Code Coverage Parameters dialog, you can debug as normal. As you debug, you will see red and green colorization marks on the left side of the source that is being debugged, next to each sequential instruction. These marks denote whether or not the sequential instruction, and therefore the code itself, is being run: green means run and red means not run.
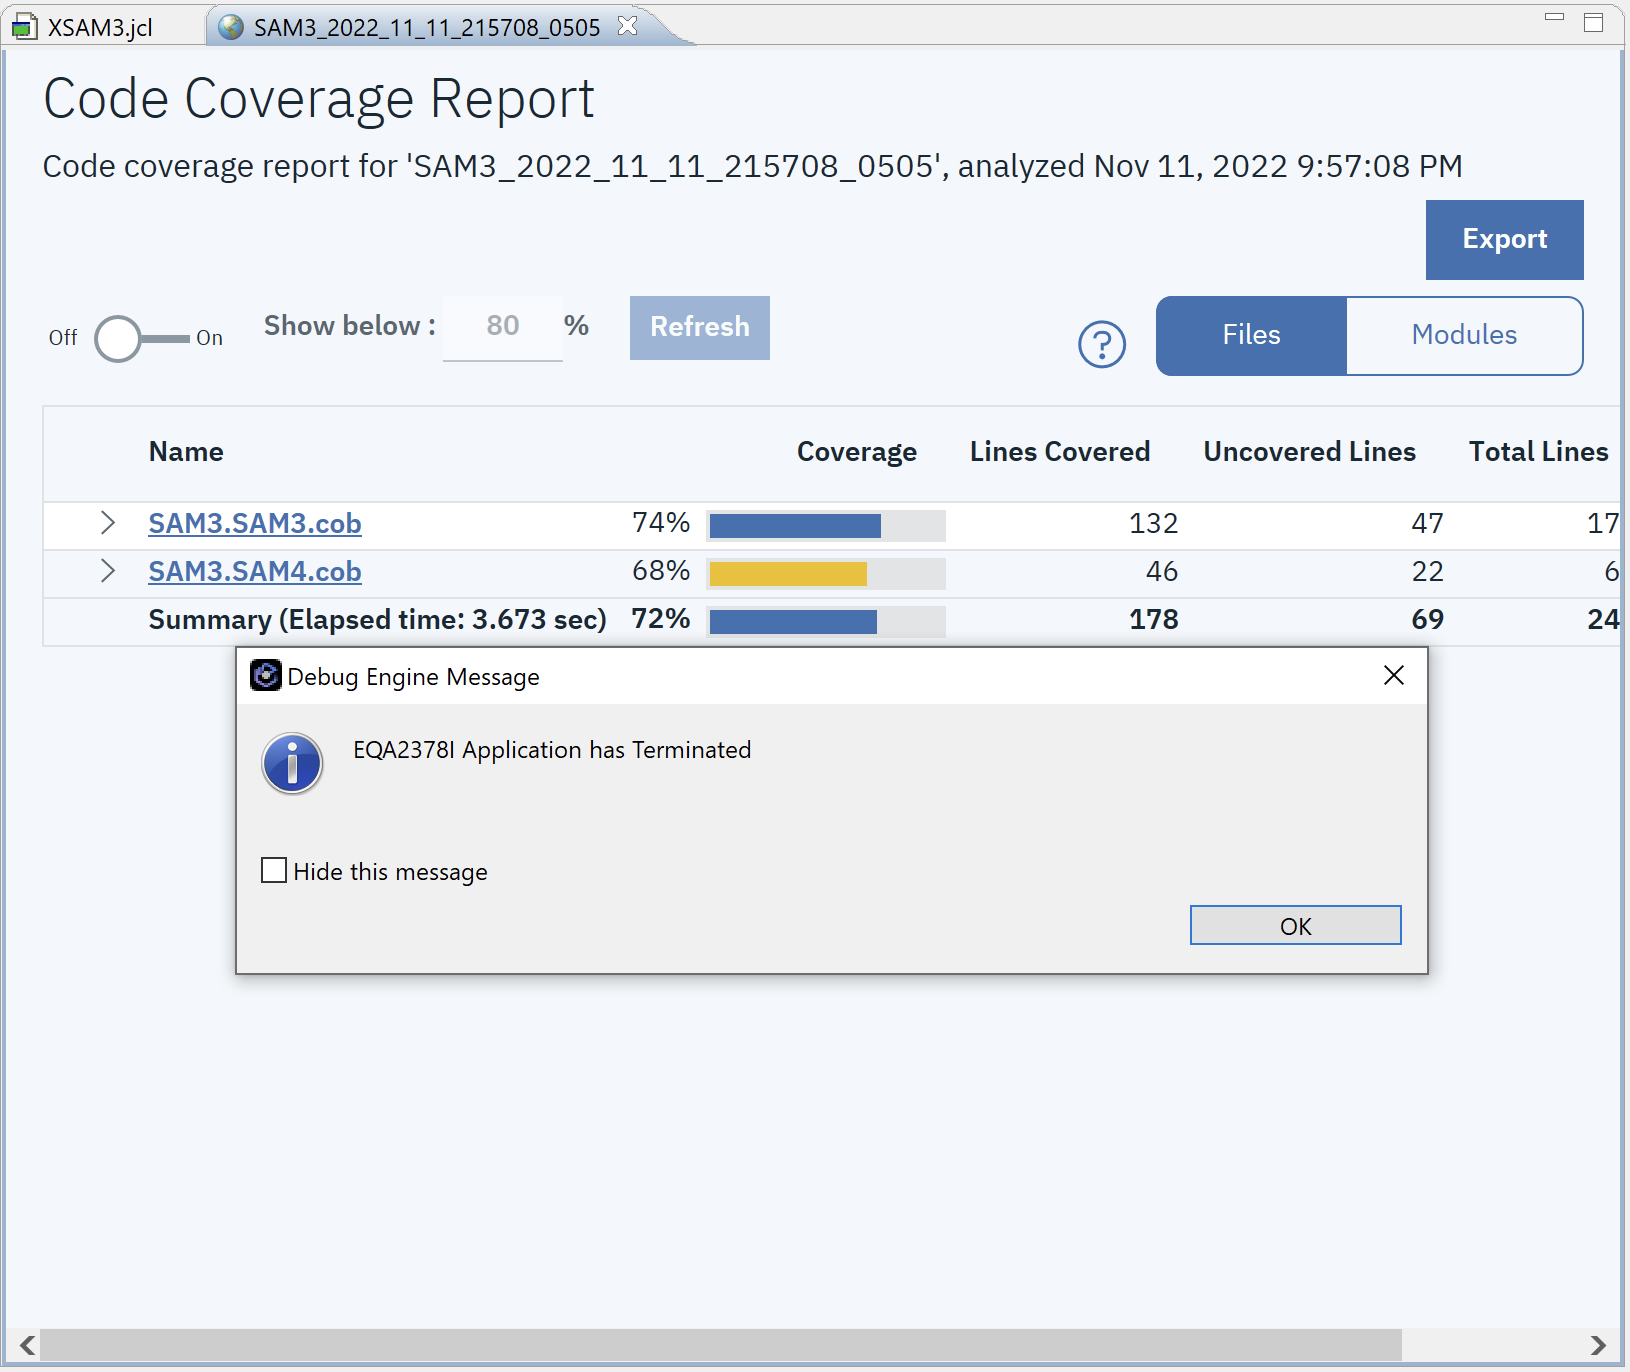
When your debug session is complete, code coverage will automatically generate a report and display it in the editor within the workbench.
Summary
In this tutorial, you learned how to enable concurrent code coverage and debug the source code, which generates a code coverage report at the end of the debug session.
For more information, helpful techniques, and tips, check out the IDz Distance Learning Course, a no-charge, instructor-led enablement program that is held quarterly. The program has been expanded to include two new learning tracks, all at no cost to the attendees.
